
How the air-Q Smart Widgets Work: A Step-by-Step Guide
With our air-Q Smart Widgets, you can display readings live across many channels and devices. This lets you show sensor data as a current reading, development chart, or index on info screens, websites, or in presentations. We now explain how this works and what use cases the Smart Widgets offer you.
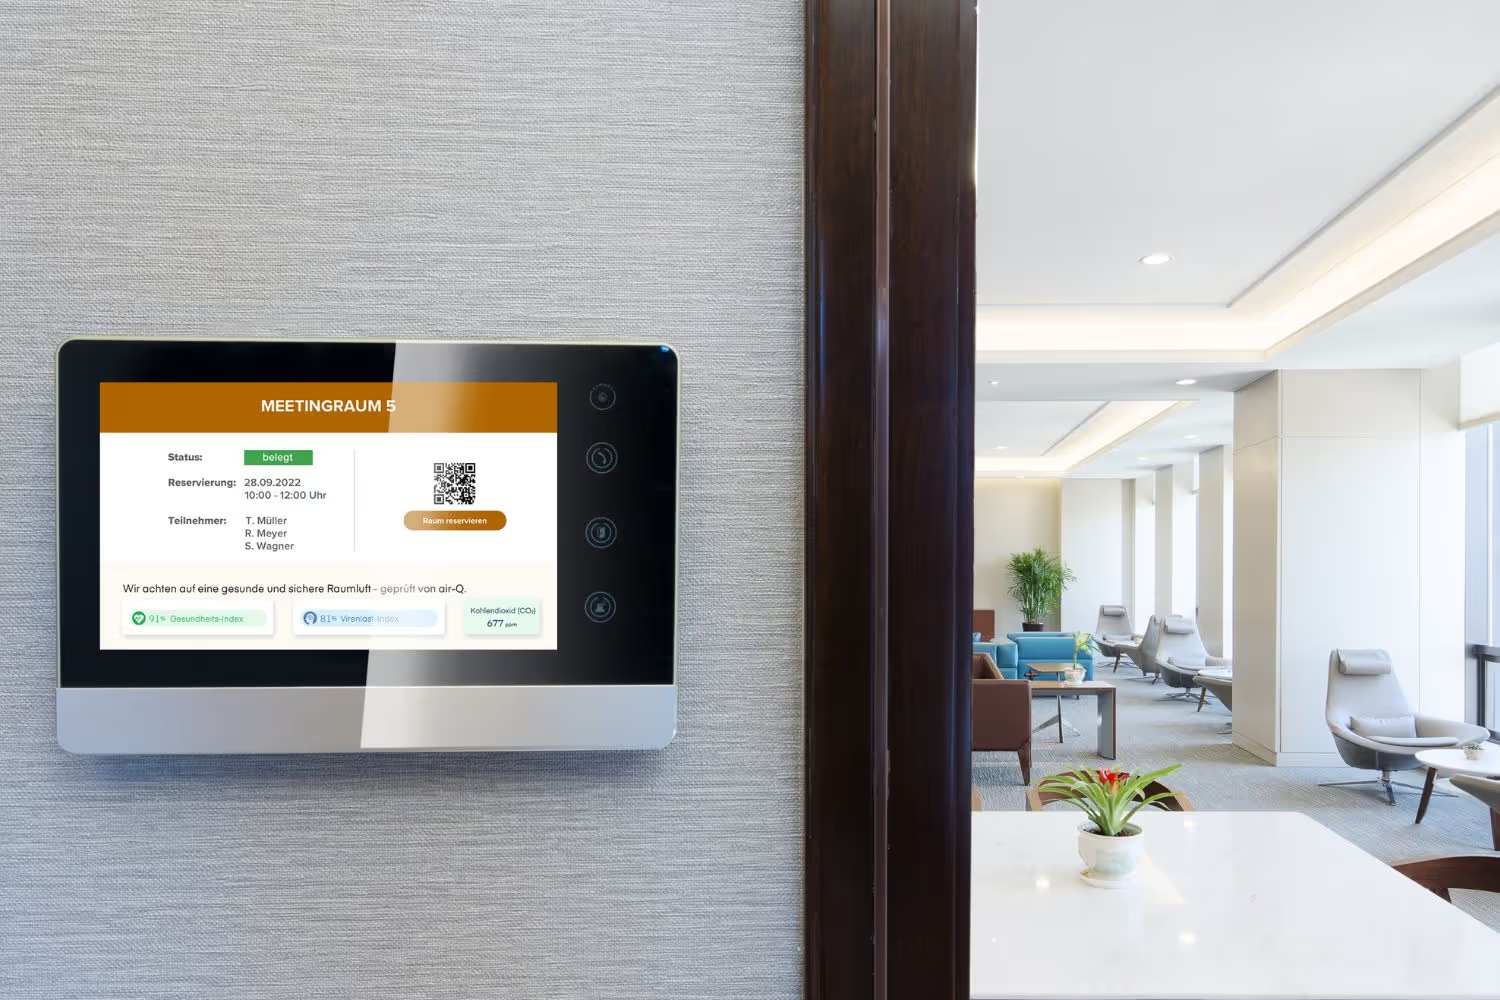
Visualizing air-Q sensor readings with Smart Widgets
Present air quality and air components in your high-occupancy rooms: such as medical practices and waiting rooms, offices, conference/meeting/training rooms, schools, gyms, or training facilities. Our Smart Widgets provide the interface for this. With them, you can display the data measured by the air-Q air quality monitor in an audience-friendly way on your website, on info screens in your rooms, or during a PowerPoint presentation.
To display the widgets, you just need a constant internet connection and need to embed the HTML code beforehand. Activating and deactivating our Smart Widgets is very easy. They can simply be embedded via a ready-made HTML snippet and then update themselves automatically every 2 minutes. No matter which device you want to display the responsive widgets on, they always adapt to the screen size and are therefore always displayed optimally. This lets you present the measurement data both on small screens like a smartphone and on a large screen.
In our guide, you'll find:
1. Creating & publishing air-Q Smart Widgets: how it works
2. Step 1: choose a reading
3. Step 2: display live data or a static value
4. Step 3: choose a display type
4.1 Smart Widget type: Index
4.2 Smart Widget type: Numeric
4.3 Smart Widget type: Chart
5. Embedding Smart Widgets in a PowerPoint presentation
6. Explainer video step-by-step guide
1. Creating & publishing air-Q Smart Widgets: how it works
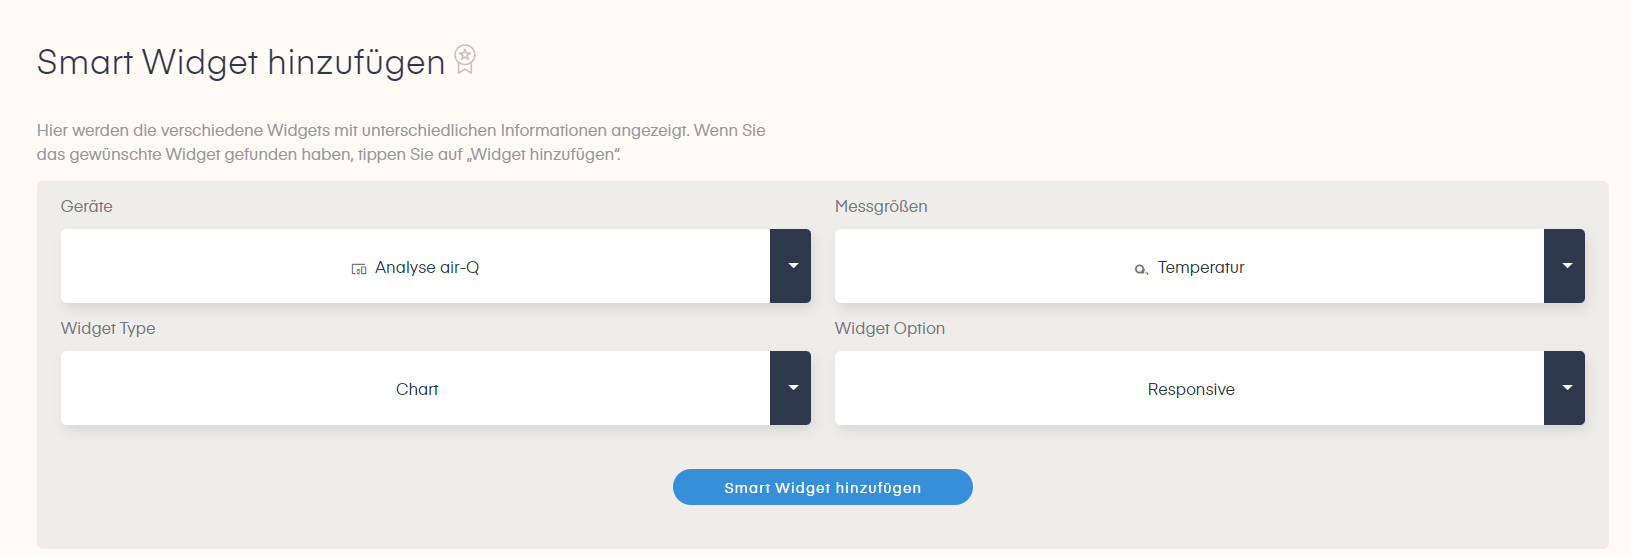
This is what the start screen for customizing your Smart Widgets looks like. Here you have various options via dropdown settings:
- You select the desired air-Q device.
- You choose the desired reading to present from all readings.
- You set the display type for the reading: as a chart, index, or numeric display. (We describe the individual types in detail below.)
- You define whether a live value or a static value should be displayed.
2. Step 1: choose a reading
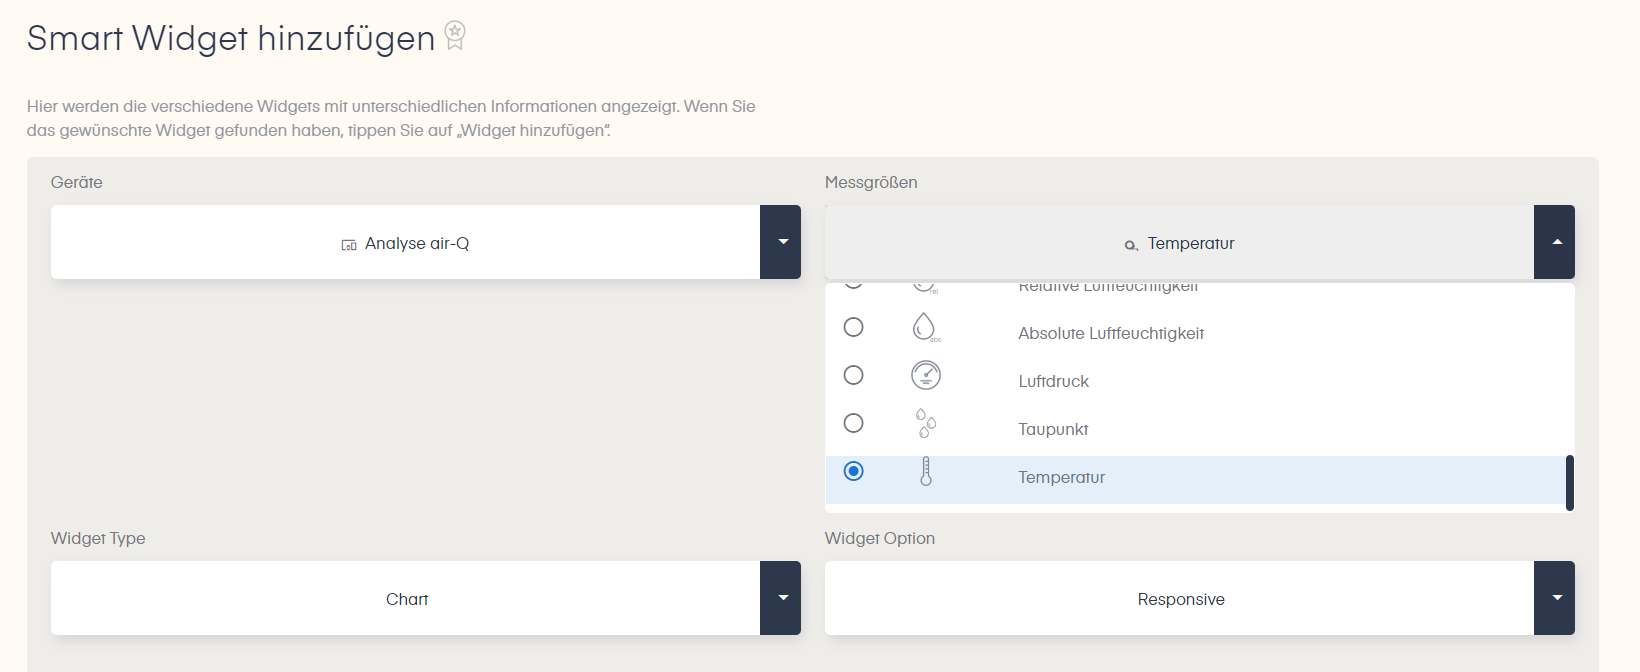
To select your desired reading, click the arrow under "Readings." A dropdown opens listing all readings. Select your desired reading by tapping/clicking. In our example, the reading "temperature" is set. Activated settings are each marked with a blue-highlighted row.
3. Step 2: display live data or a static value
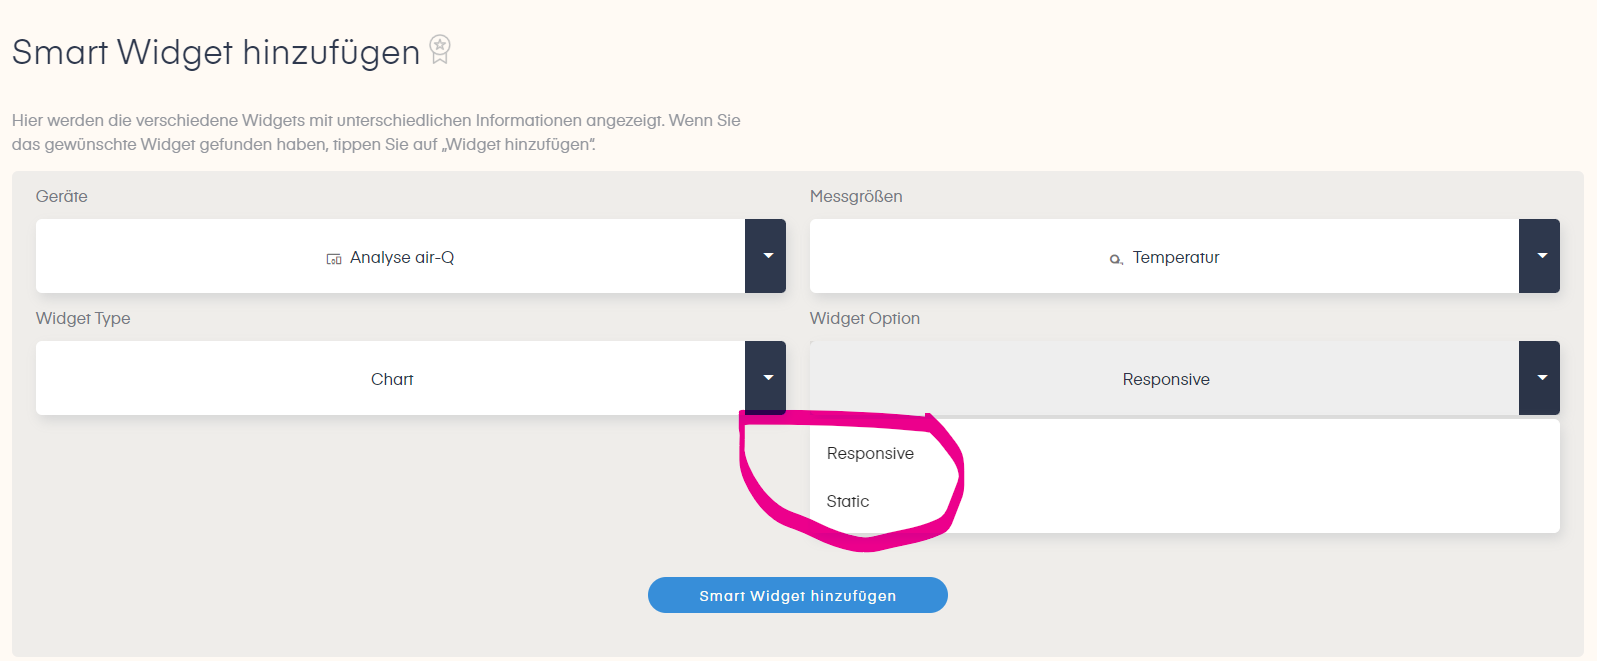
Next, under "Widget Option," use the dropdown to define whether you want to display a responsive or static value. Tap/click "Responsive" to display continuously updating values, meaning live data. Tap/click "Static" to display a static snapshot.
4. Step 3: choose a display type
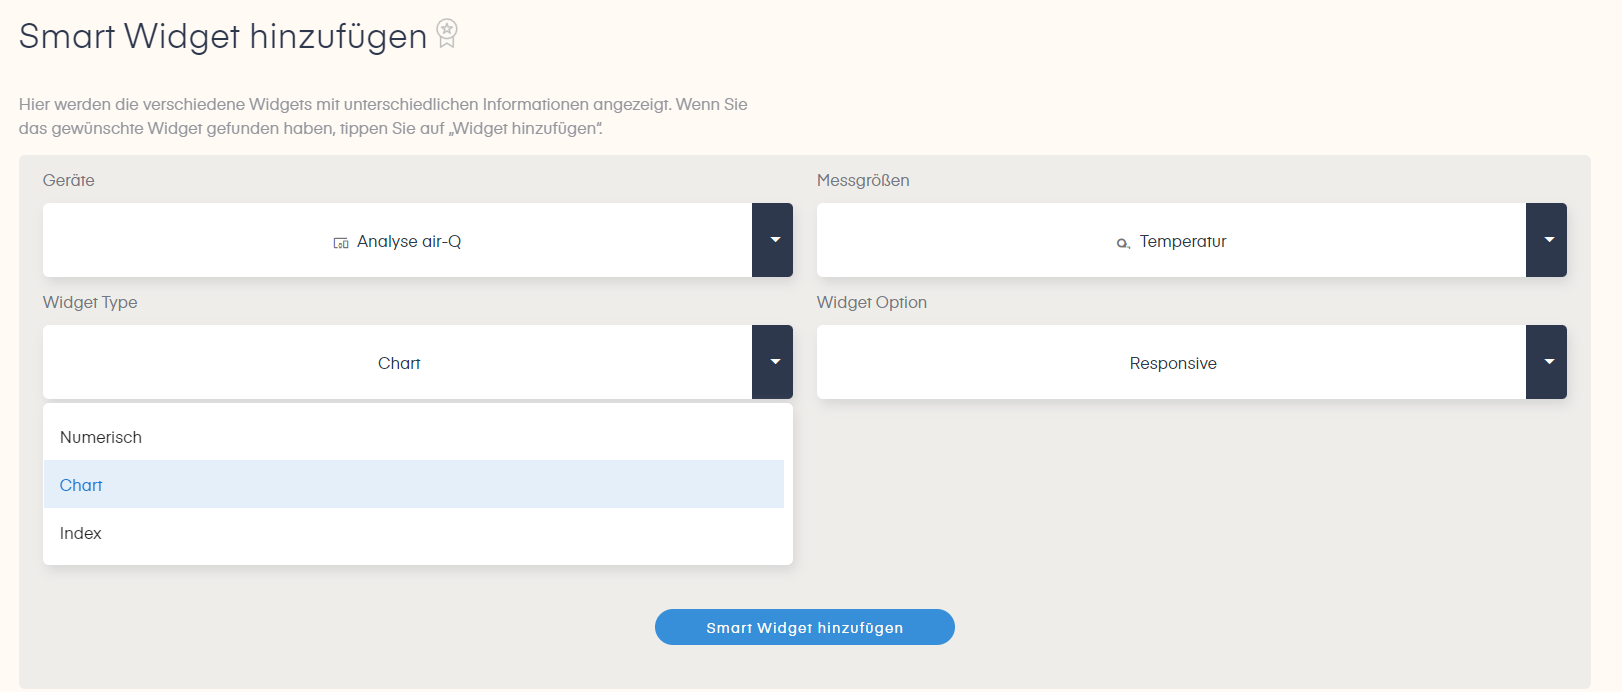
Finally, under "Widget Type," select the format in which your readings should be displayed by the Smart Widgets. You thus set the visual style: "Numeric," "Chart," or "Index." To do this, tap/click the arrow as well, open the dropdown, and select your desired display type. Once your settings are complete, save them by tapping/clicking the "Add Smart Widget" button.
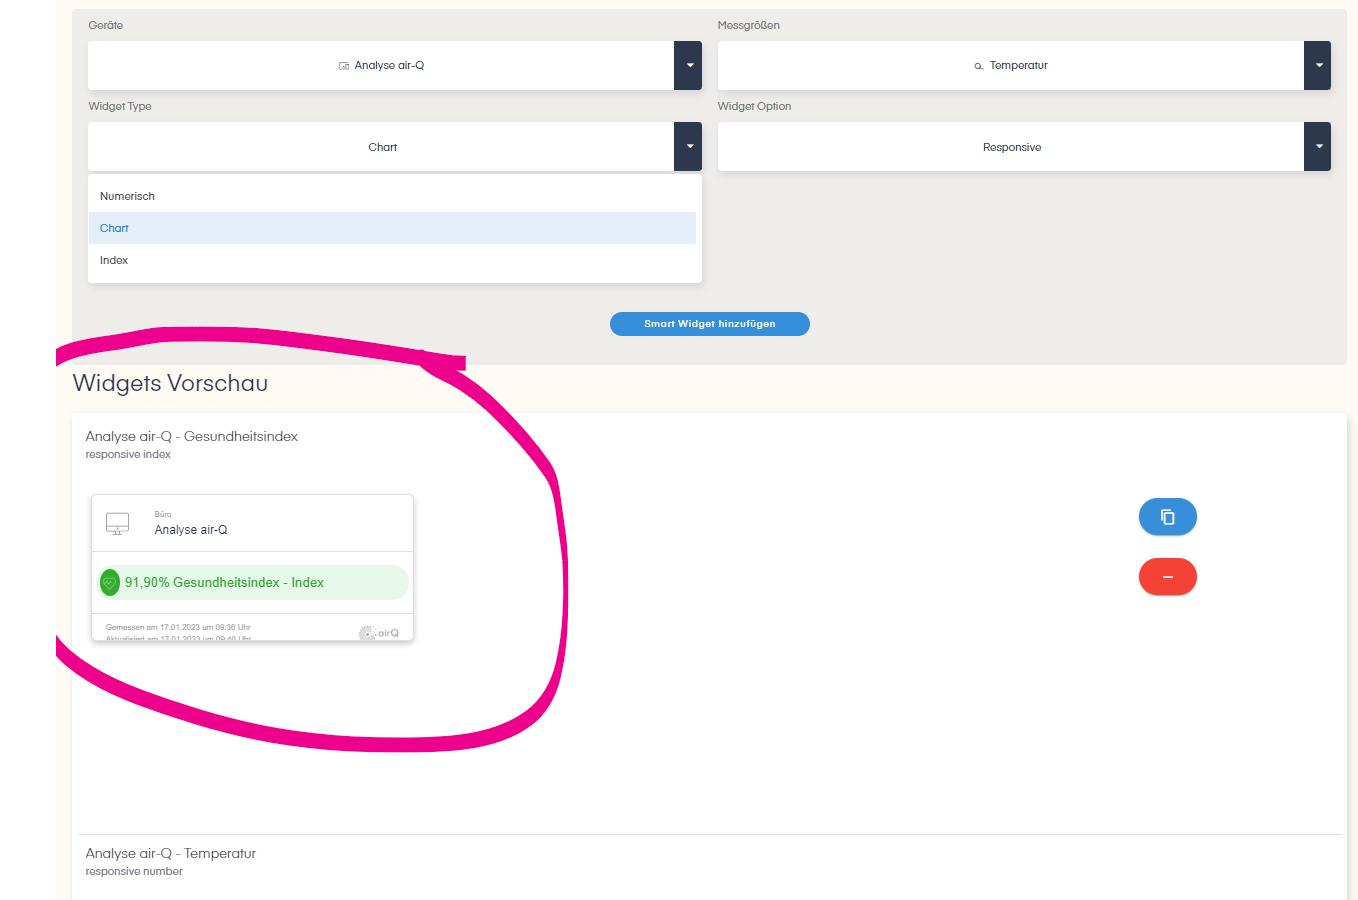
When the widget is created, a corresponding notice text is displayed to you. The process can sometimes take a few minutes. Once the widget is activated, it's displayed to you in the preview below the settings.
4.1 Smart Widget type: Index
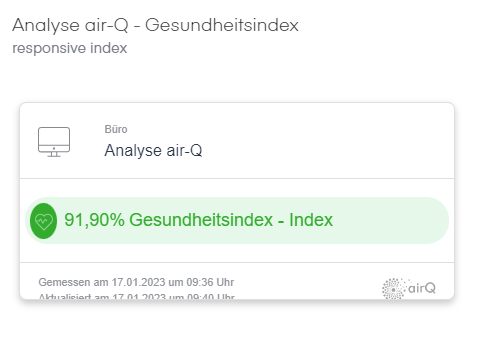
The index shows you the selected reading similarly to a barometer, showing the percentage quality of the index. You can choose the following indices:
- Health index
- Performance index
- Virus-free index
Depending on the chosen index, you learn how good or poor the air quality in the room is, and get insight into its effects on your health, performance, and infection risk.
Tip: read how our virus-free index works in our blog post.
4.2 Smart Widget type: Numeric
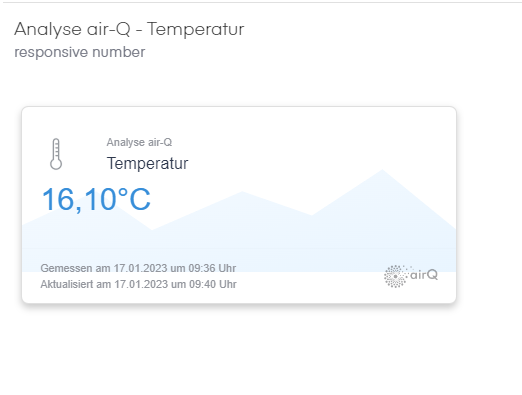
With the "Numeric" widget type, you display the reading's concentration as a number.
4.3 Smart Widget type: Chart
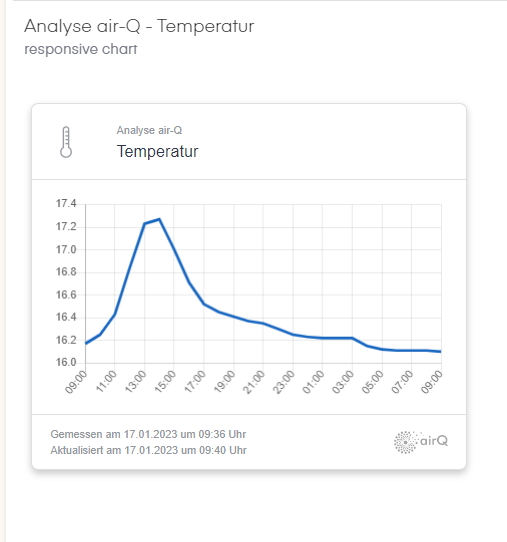
To show the reading's development over time (24h), select the "Chart" widget type. Using a chart, you can display concentration over time in a coordinate system.
Note: creating charts sometimes takes a bit longer. You can refresh the page in the meantime if the widget isn't ready after a few minutes. It's usually activated by then.
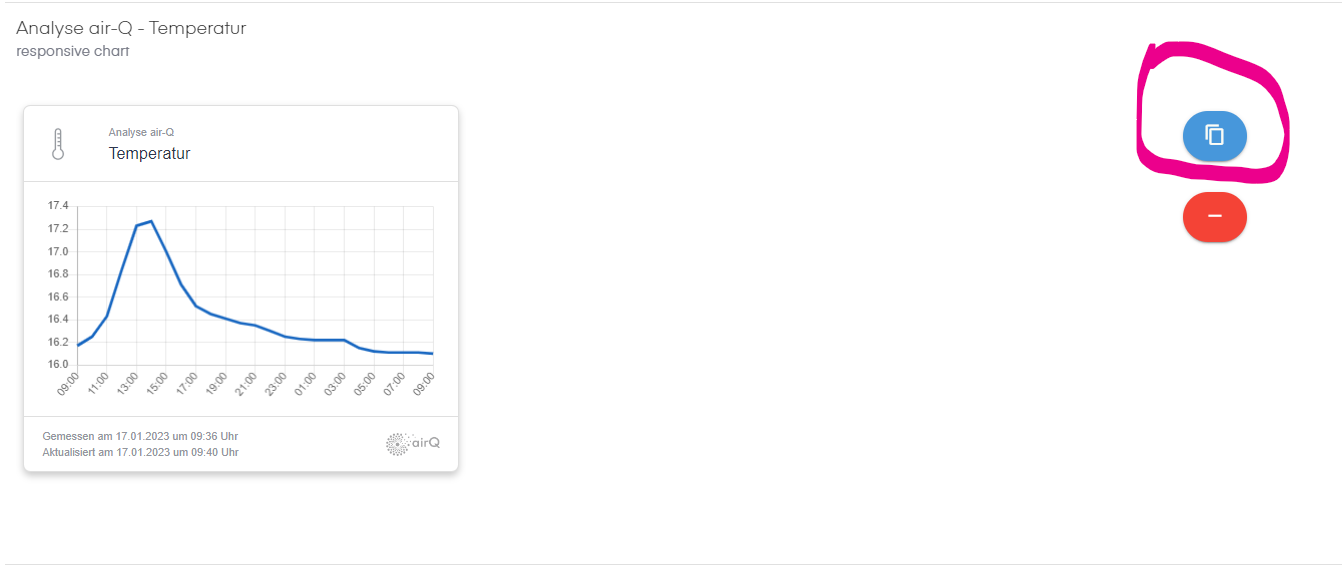
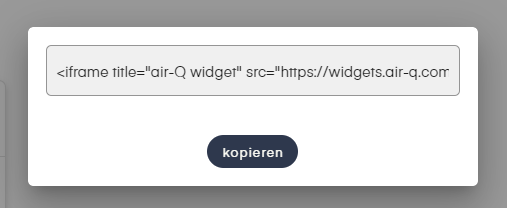
Using the button on the duplicated page, at the top right, you can copy the code snippet. To embed the widget on a website in the backend, you need to copy the entire code. To do this, tap/click the "copy" button.
5. Integrating air-Q Smart Widgets into a PowerPoint presentation
To embed the Smart Widgets, you need Microsoft's Web Viewer plugin. Once you have Web Viewer installed, when creating your presentation in PowerPoint, you can select the "My Add-Ins" dropdown under "Insert" and add "Web Viewer" here.
Then create one or more widgets in the air-Q cloud or via My air-Q. Then add the URL of your air-Q Smart Widget to your Web Viewer add-in by entering the URL in the field. The embedded widgets can now be edited and moved like an image, so you can style your slide exactly the way you want.
We've also compiled a separate guide summarizing how to embed the widget in a PowerPoint presentation. You can get it as a PDF download.
6. Our video guide
With our widgets, you offer your customers informative entertainment. Besides the entertainment value, you emphasize your commitment to health and quality room air. This builds trust with your customers, employees, and others.
Cover image: air-Q/canva.com