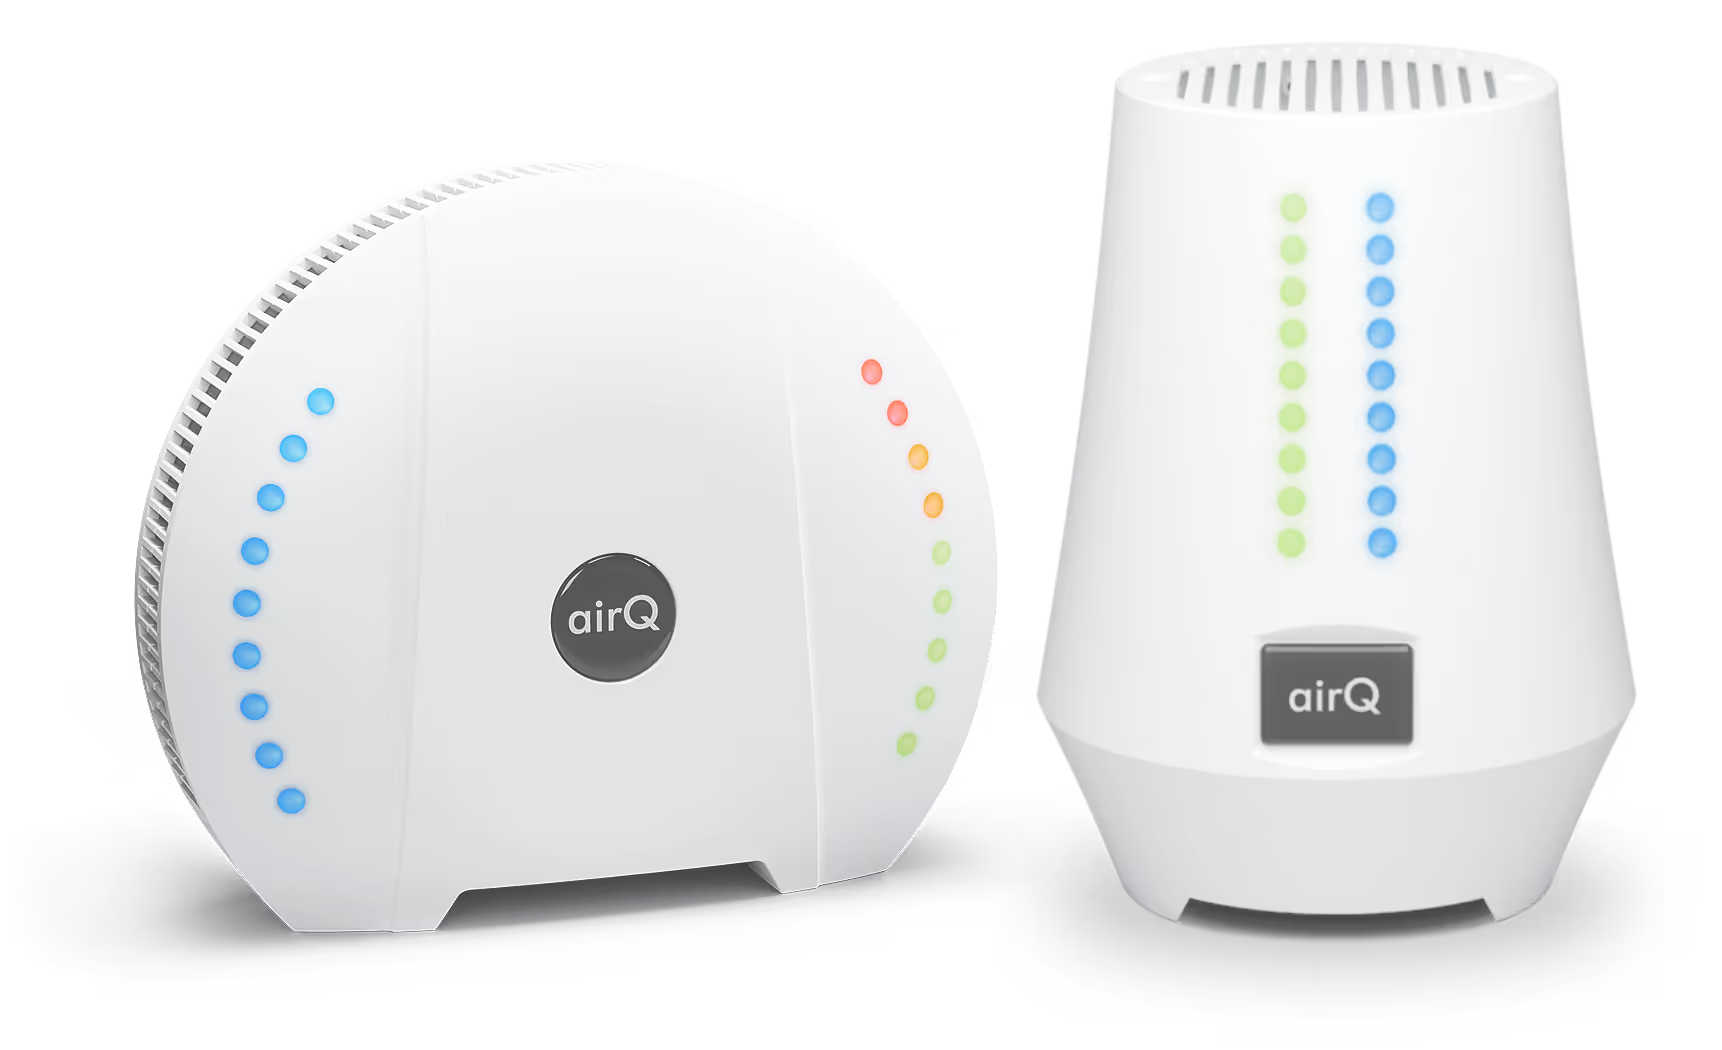
Analyze All Sensors and Readings on Your PC with the air-Q Web App.
With the air-Q Web App, measurement results can be evaluated even more professionally. This lets you compare readings in charts and tables across different air-Q devices. Especially with a larger number of devices, the air-Q Web App shows its strengths and increases clarity.
To the air-Q Web App
Access Sensors and Measurement Data Even More Clearly via Browser - with Innovative Features
To use the air-Q Web App, a free cloud account is required. In addition, the optional upload of measurement data to the air-Q Cloud must be activated — no data is automatically uploaded to our cloud. The Web App can then be used alongside the smartphone app, or as a standalone solution, to run advanced air analyses. Thanks to the additional options on your PC, measurement data can be examined even more precisely. For example, if 10 or more air-Qs are in use, the Web App can provide more clarity by, among other things, displaying a table overview of all measuring devices. But that’s far from everything our cloud software can do.
Using the air-Q Web App is free.
The air-Q Web App Features Explained
Overview via the Dashboard
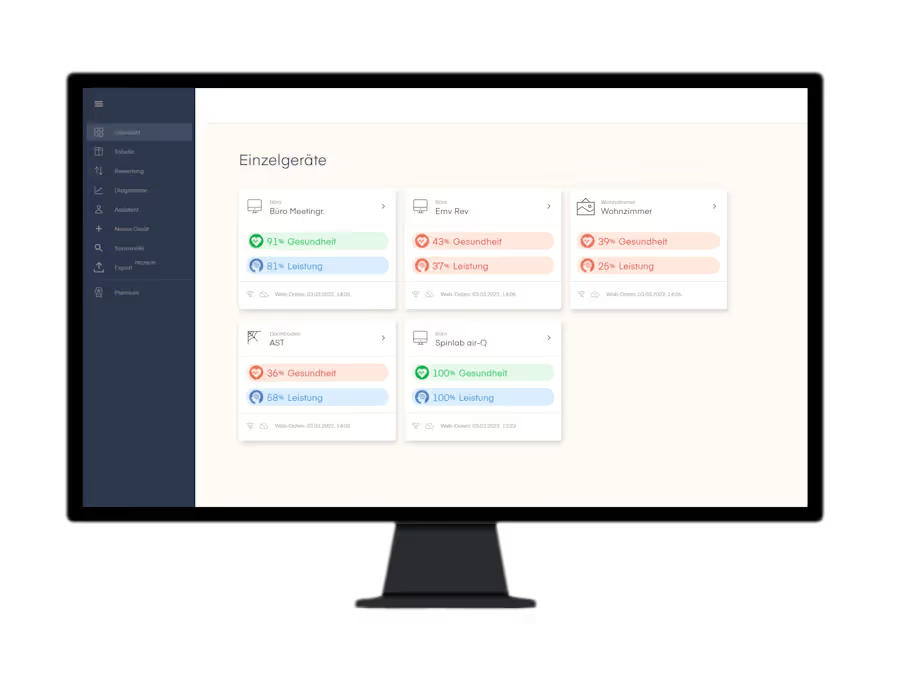
The air-Q Web App’s dashboard gives you a quick overview of all your air-Qs. These can also be sorted by category. This way, even a very large number of devices is organized well and displayed clearly. The air-Q health and performance index for air quality is immediately visible for all devices.
Tabular Display of All Sensors and Readings
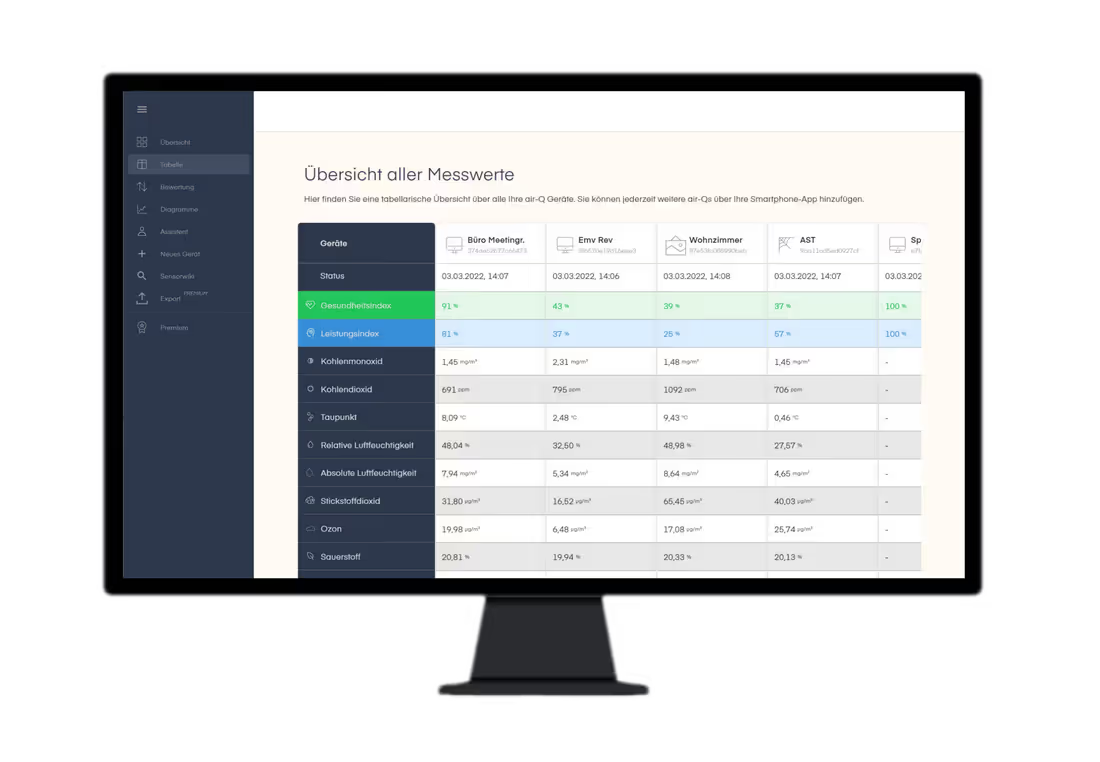
With the air-Q Web App, you get access to an informative tabular display of all sensors and readings. This lets you quickly compare all devices and sensors with each other, and always keep an easy overview. This view offers major advantages, especially with a large number of air-Qs.
Dive Deeper into the Sensors
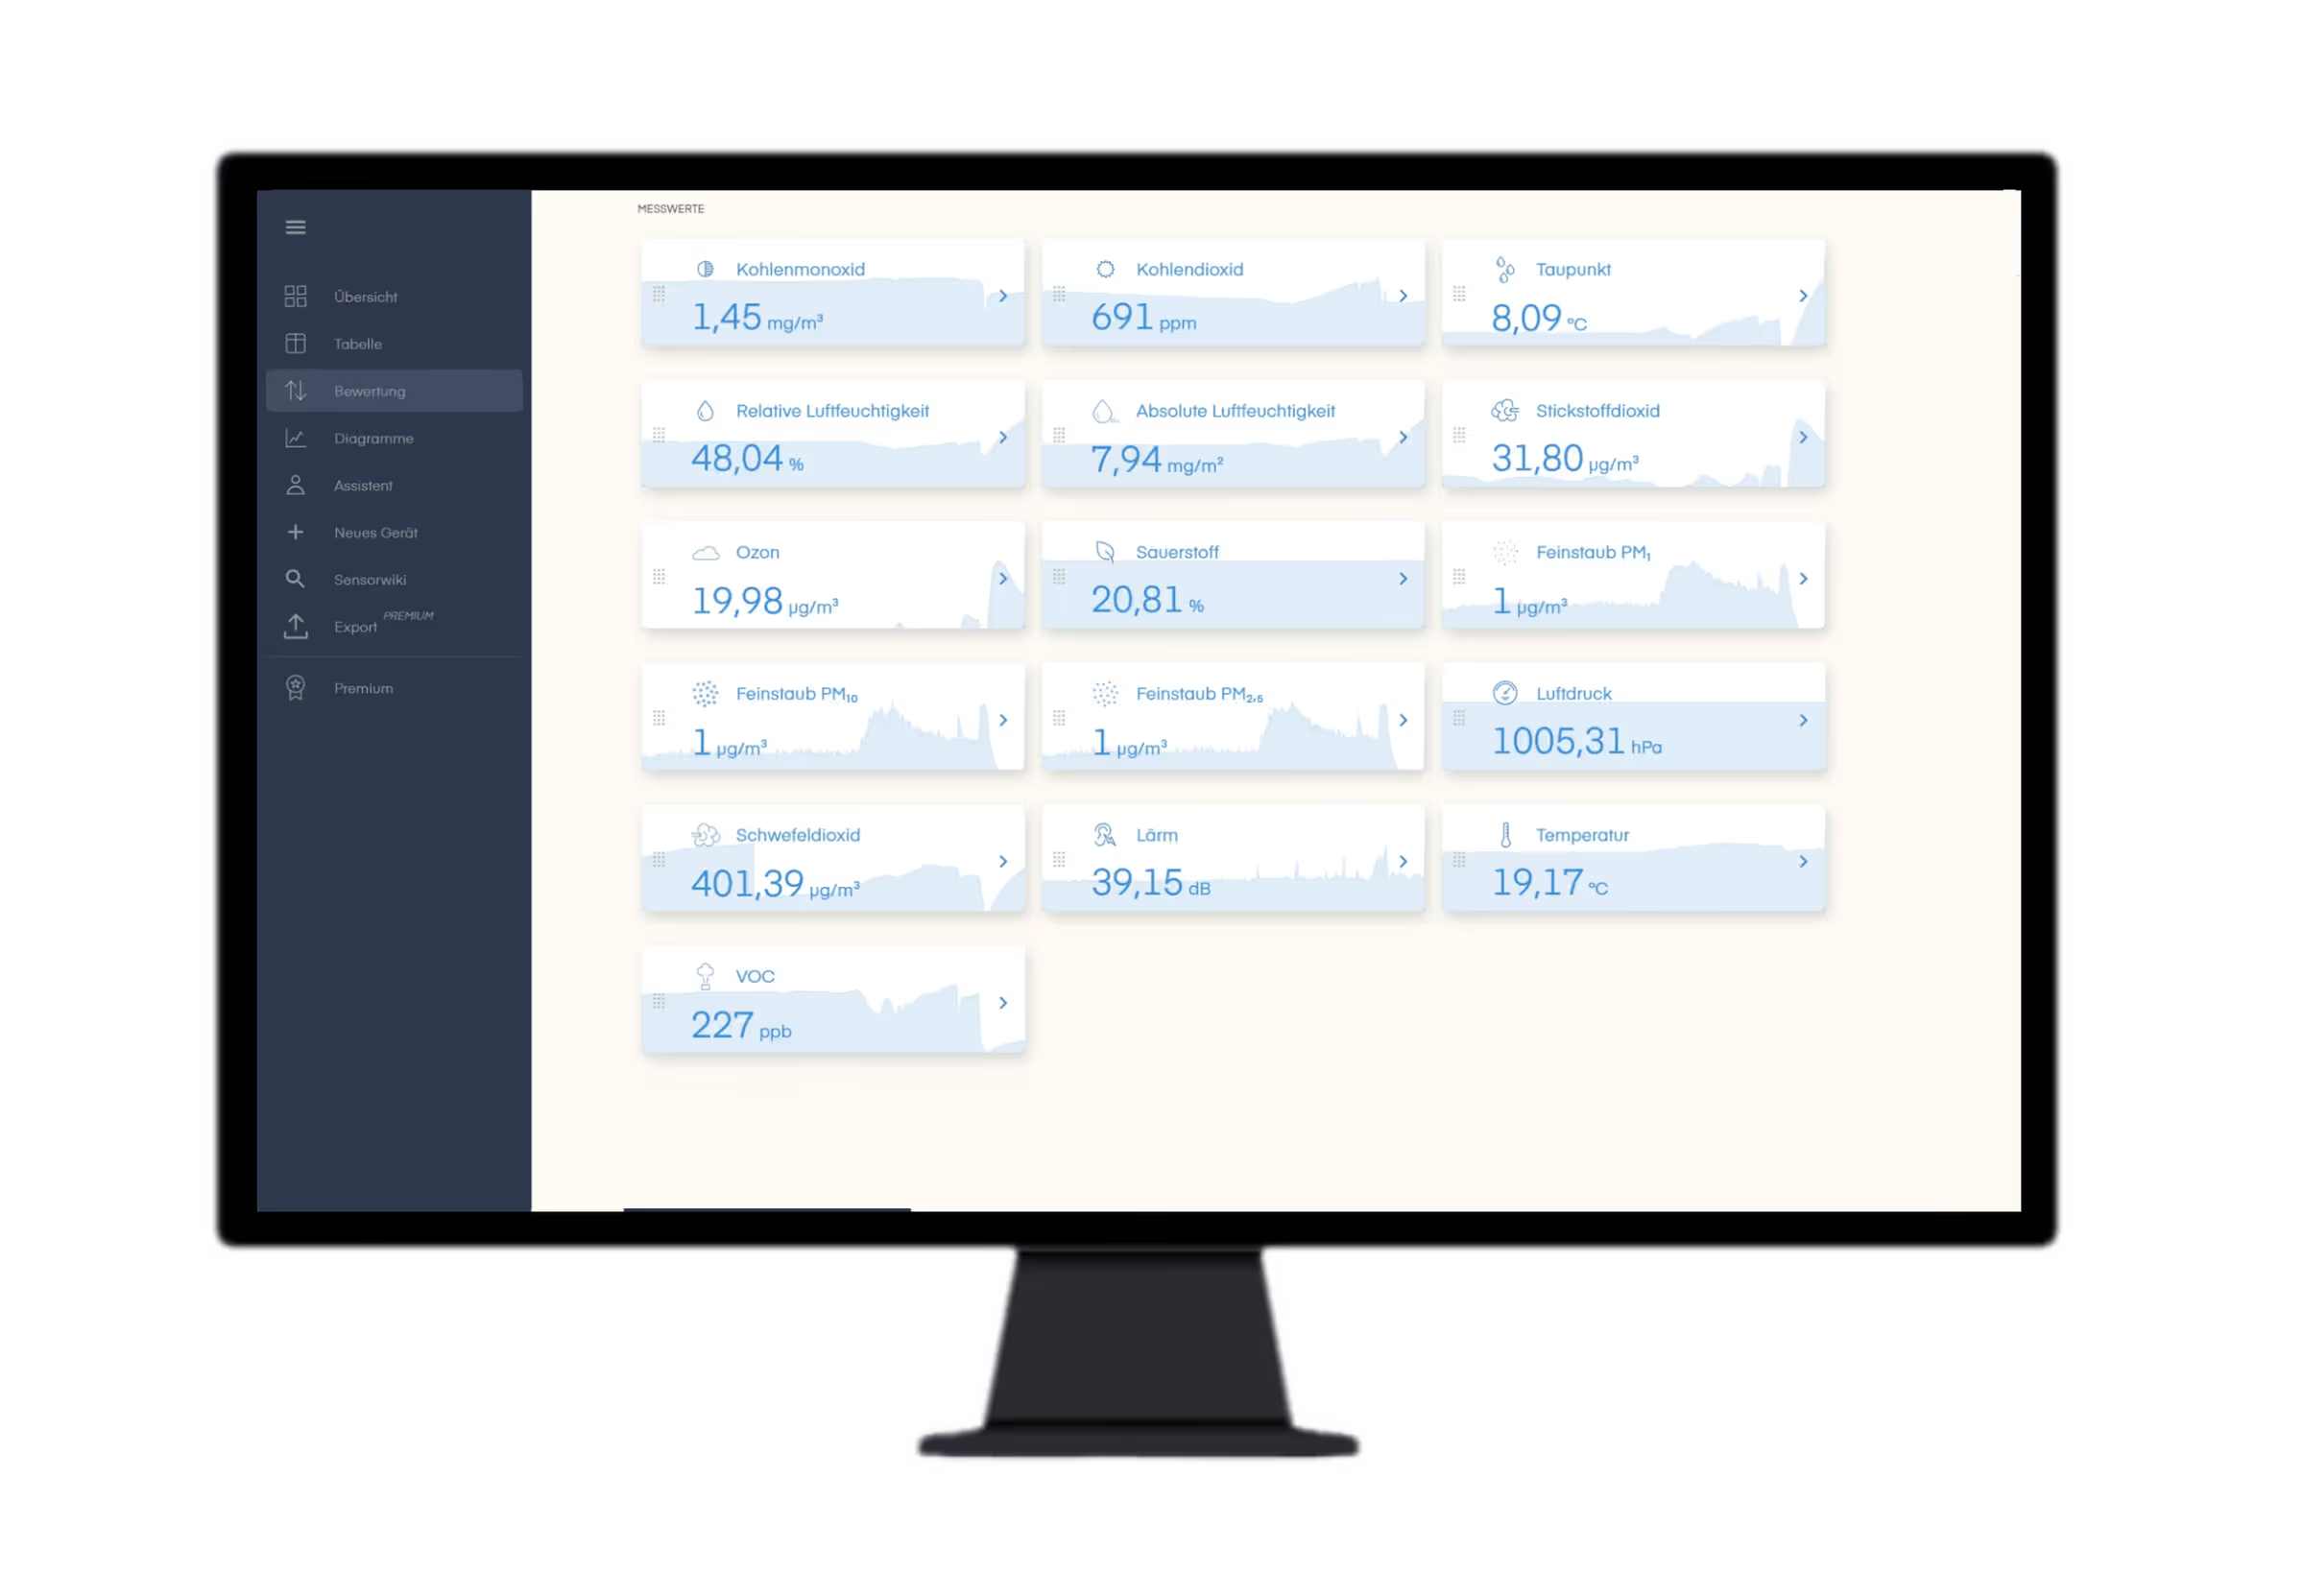
The overview page gives a simple, informative display of the trends for all sensors, plus a cumulative health and performance value (the air-Q Health Index™ and Performance Index™). Exceeding limit values is shown immediately, with the values color-coded. This makes it immediately visible when something’s wrong somewhere and action is needed.
Present Readings with Smart Widgets
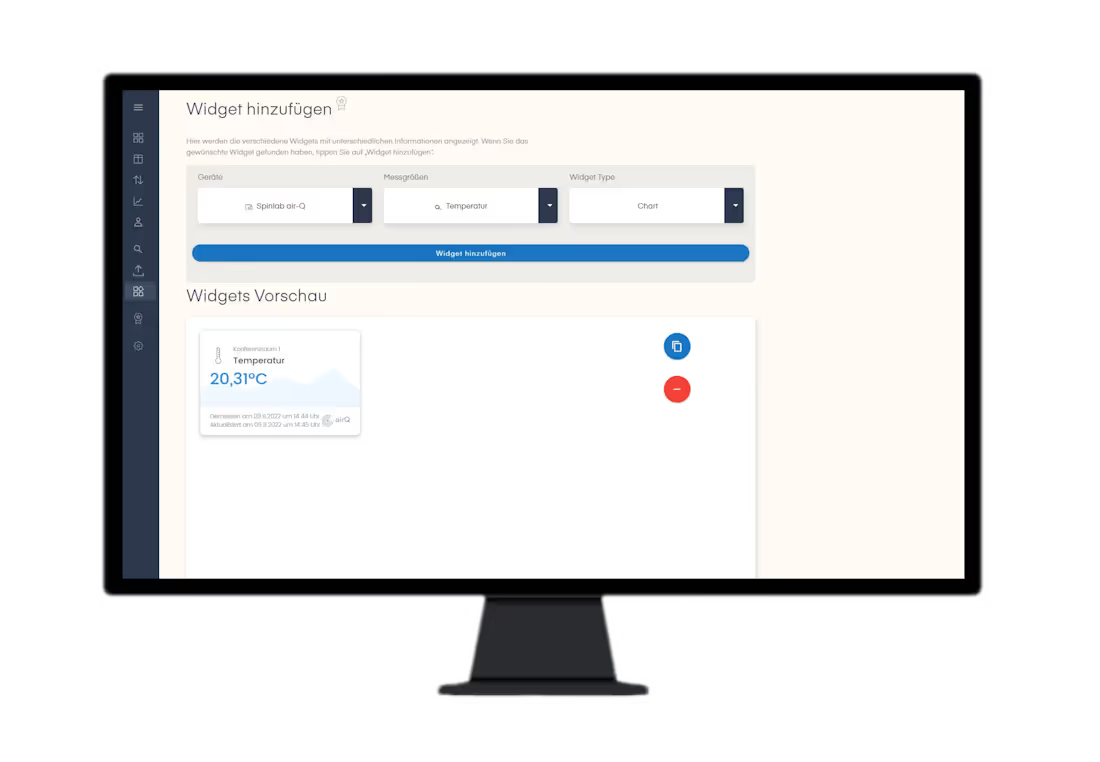
With the air-Q Smart Widgets, you can embed sensor information as small reading tiles on websites and presentations (e.g. PowerPoint) — super versatile and self-updating. Smart Widgets can be generated at my.air-q.com. (A Premium membership is required for a very large number of Smart Widgets)
Charts and Comparisons
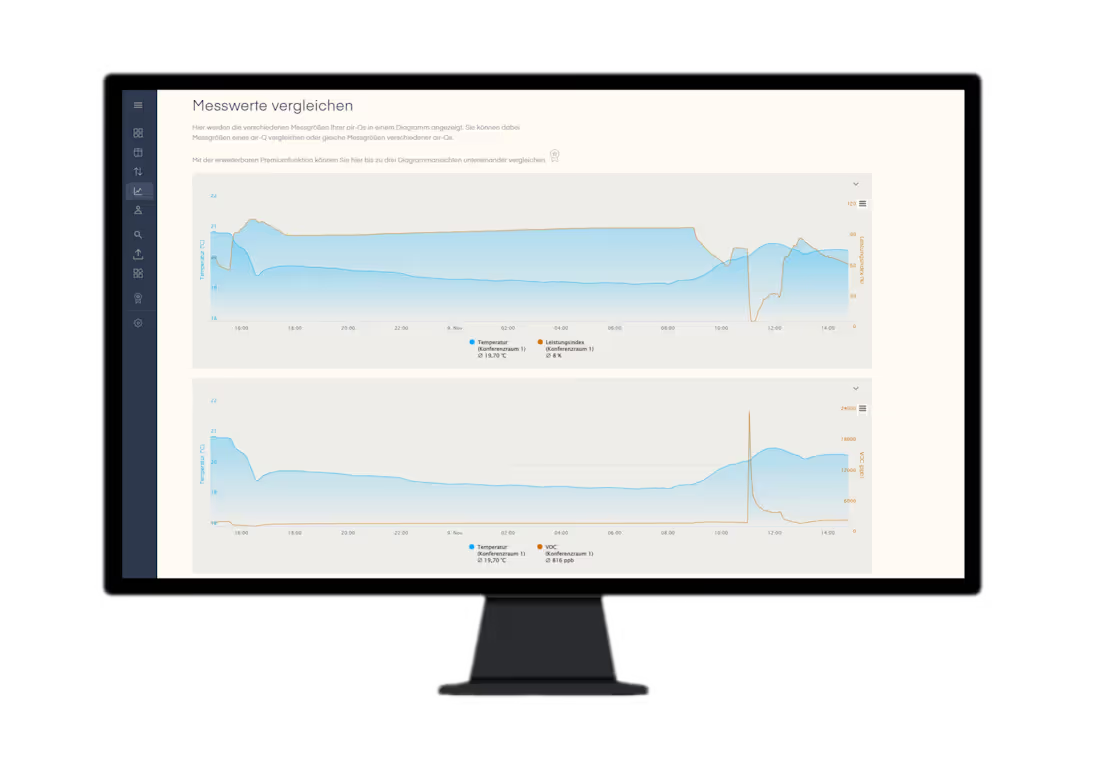
In charts, multiple sensor values can be compared, even across different air-Qs. The clever part: thanks to our special chart module, comparisons become even more informative and exciting — not only different sensors, but also different time periods can be visualized simultaneously in charts. This lets you find and analyze even the smallest changes after the fact. (A Premium membership is required for the "Advanced Charts" feature with multiple charts in one view)
Health and Performance Index
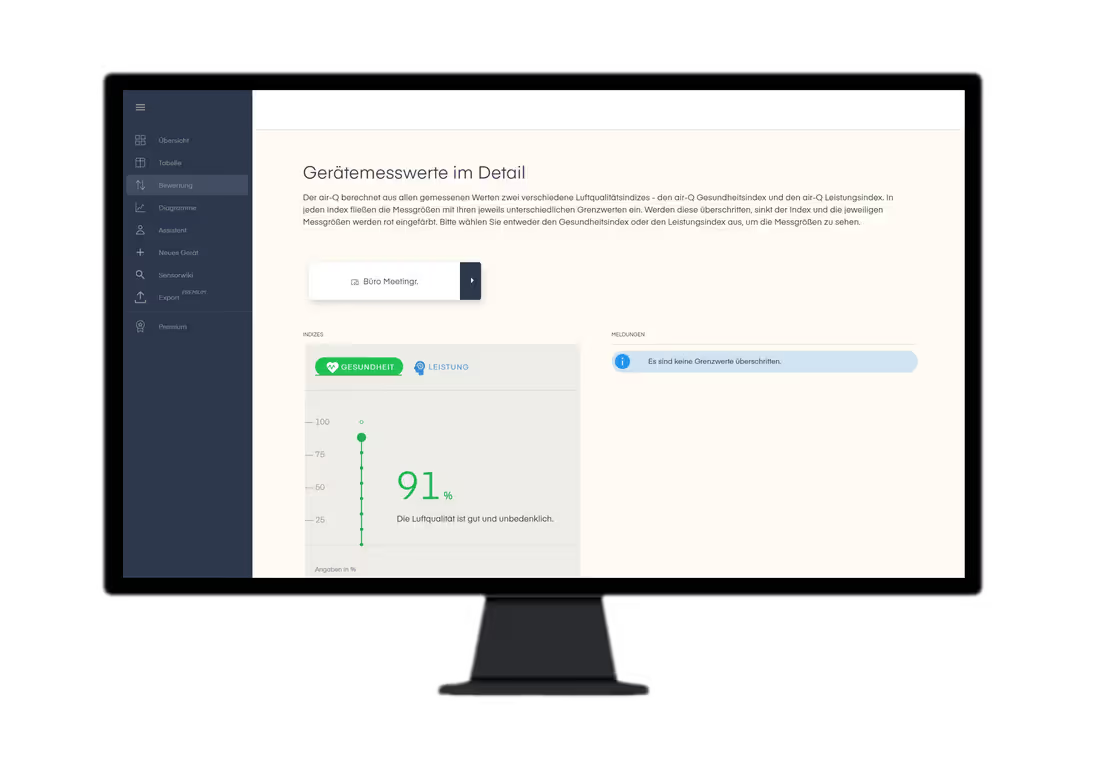
The air-Q Health and Performance Index is also used in the Web App to evaluate the multitude of readings. Building on this, the Health Advisor gives guidance when limit values are exceeded and tips on what to do.
Export All Data
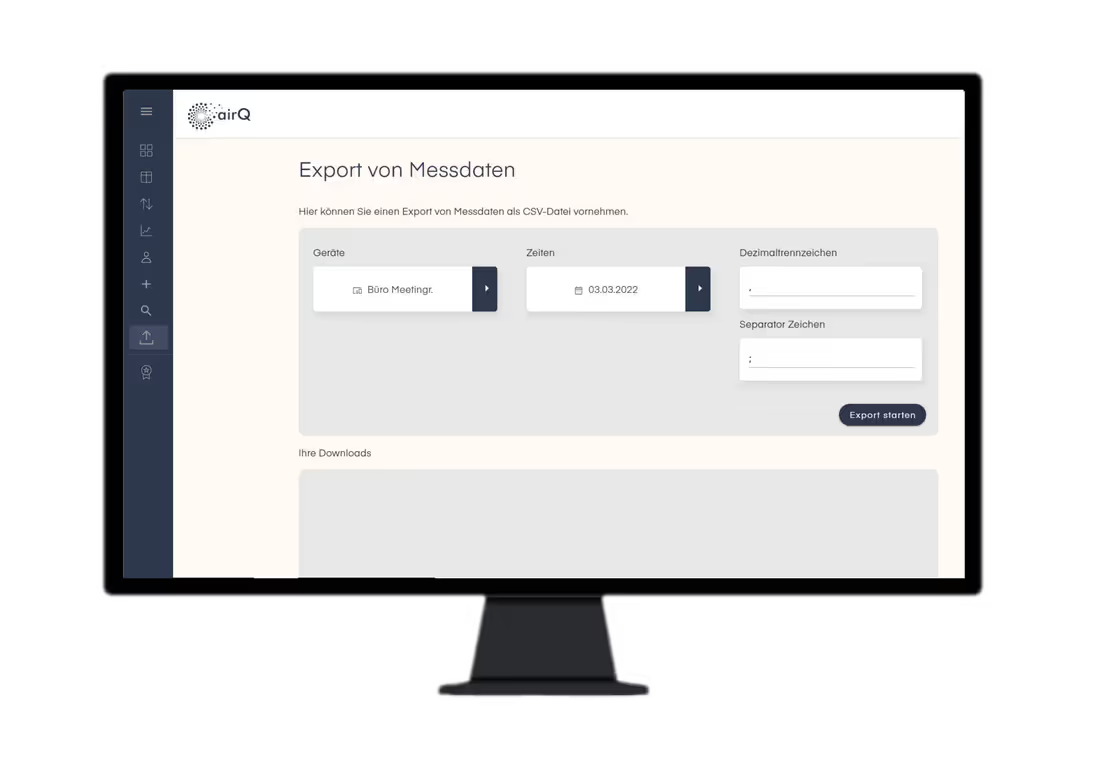
The data export allows convenient download of all measurement data. This can be downloaded as a CSV file or as a chart. (A Premium membership is required for data export via the air-Q Web App).
Sensor Wiki
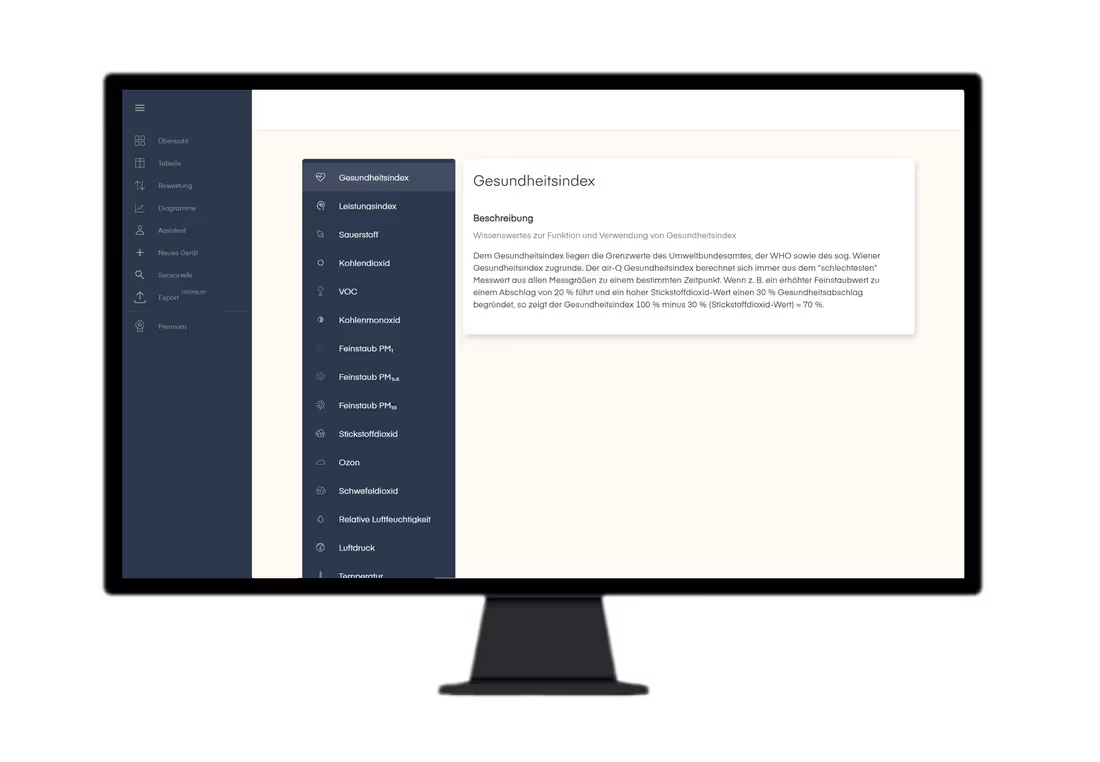
The Web App gives a comprehensive overview of all installed sensors and readings. You’ll learn more about limit values and solutions. It also covers the properties of the sensor hardware used.
Many More Features Through Updates

We pursue a long-term strategy and are constantly working on new and improved features that make analyses even better and faster. In the coming weeks, the app and Web App will be continuously expanded.
air-Q Web App Tour Video
We’ve put together a short tour of some features of the air-Q Web App.