
air-Q VIEW Dashboard – Your Complete Solution for Smart Air Quality Data
The air-Q VIEW Dashboard offers you a user-friendly and elegant solution to visualize your air quality data in real time. Perfect for businesses, schools and public institutions. Get precise, interactive and customizable insights into the air quality of your spaces, and make informed decisions to improve health and wellbeing.
air-Q VIEW Dashboard in the shop – from €649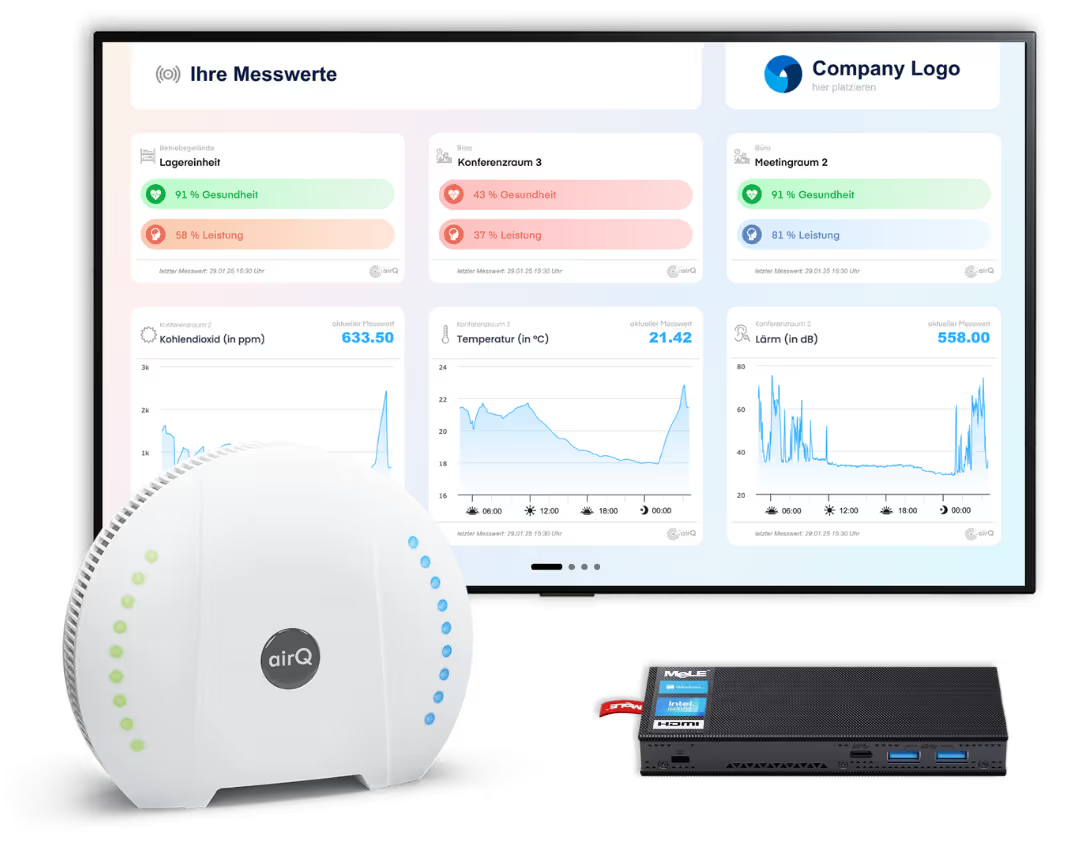
Smart Air Monitoring & Versatile Use Cases
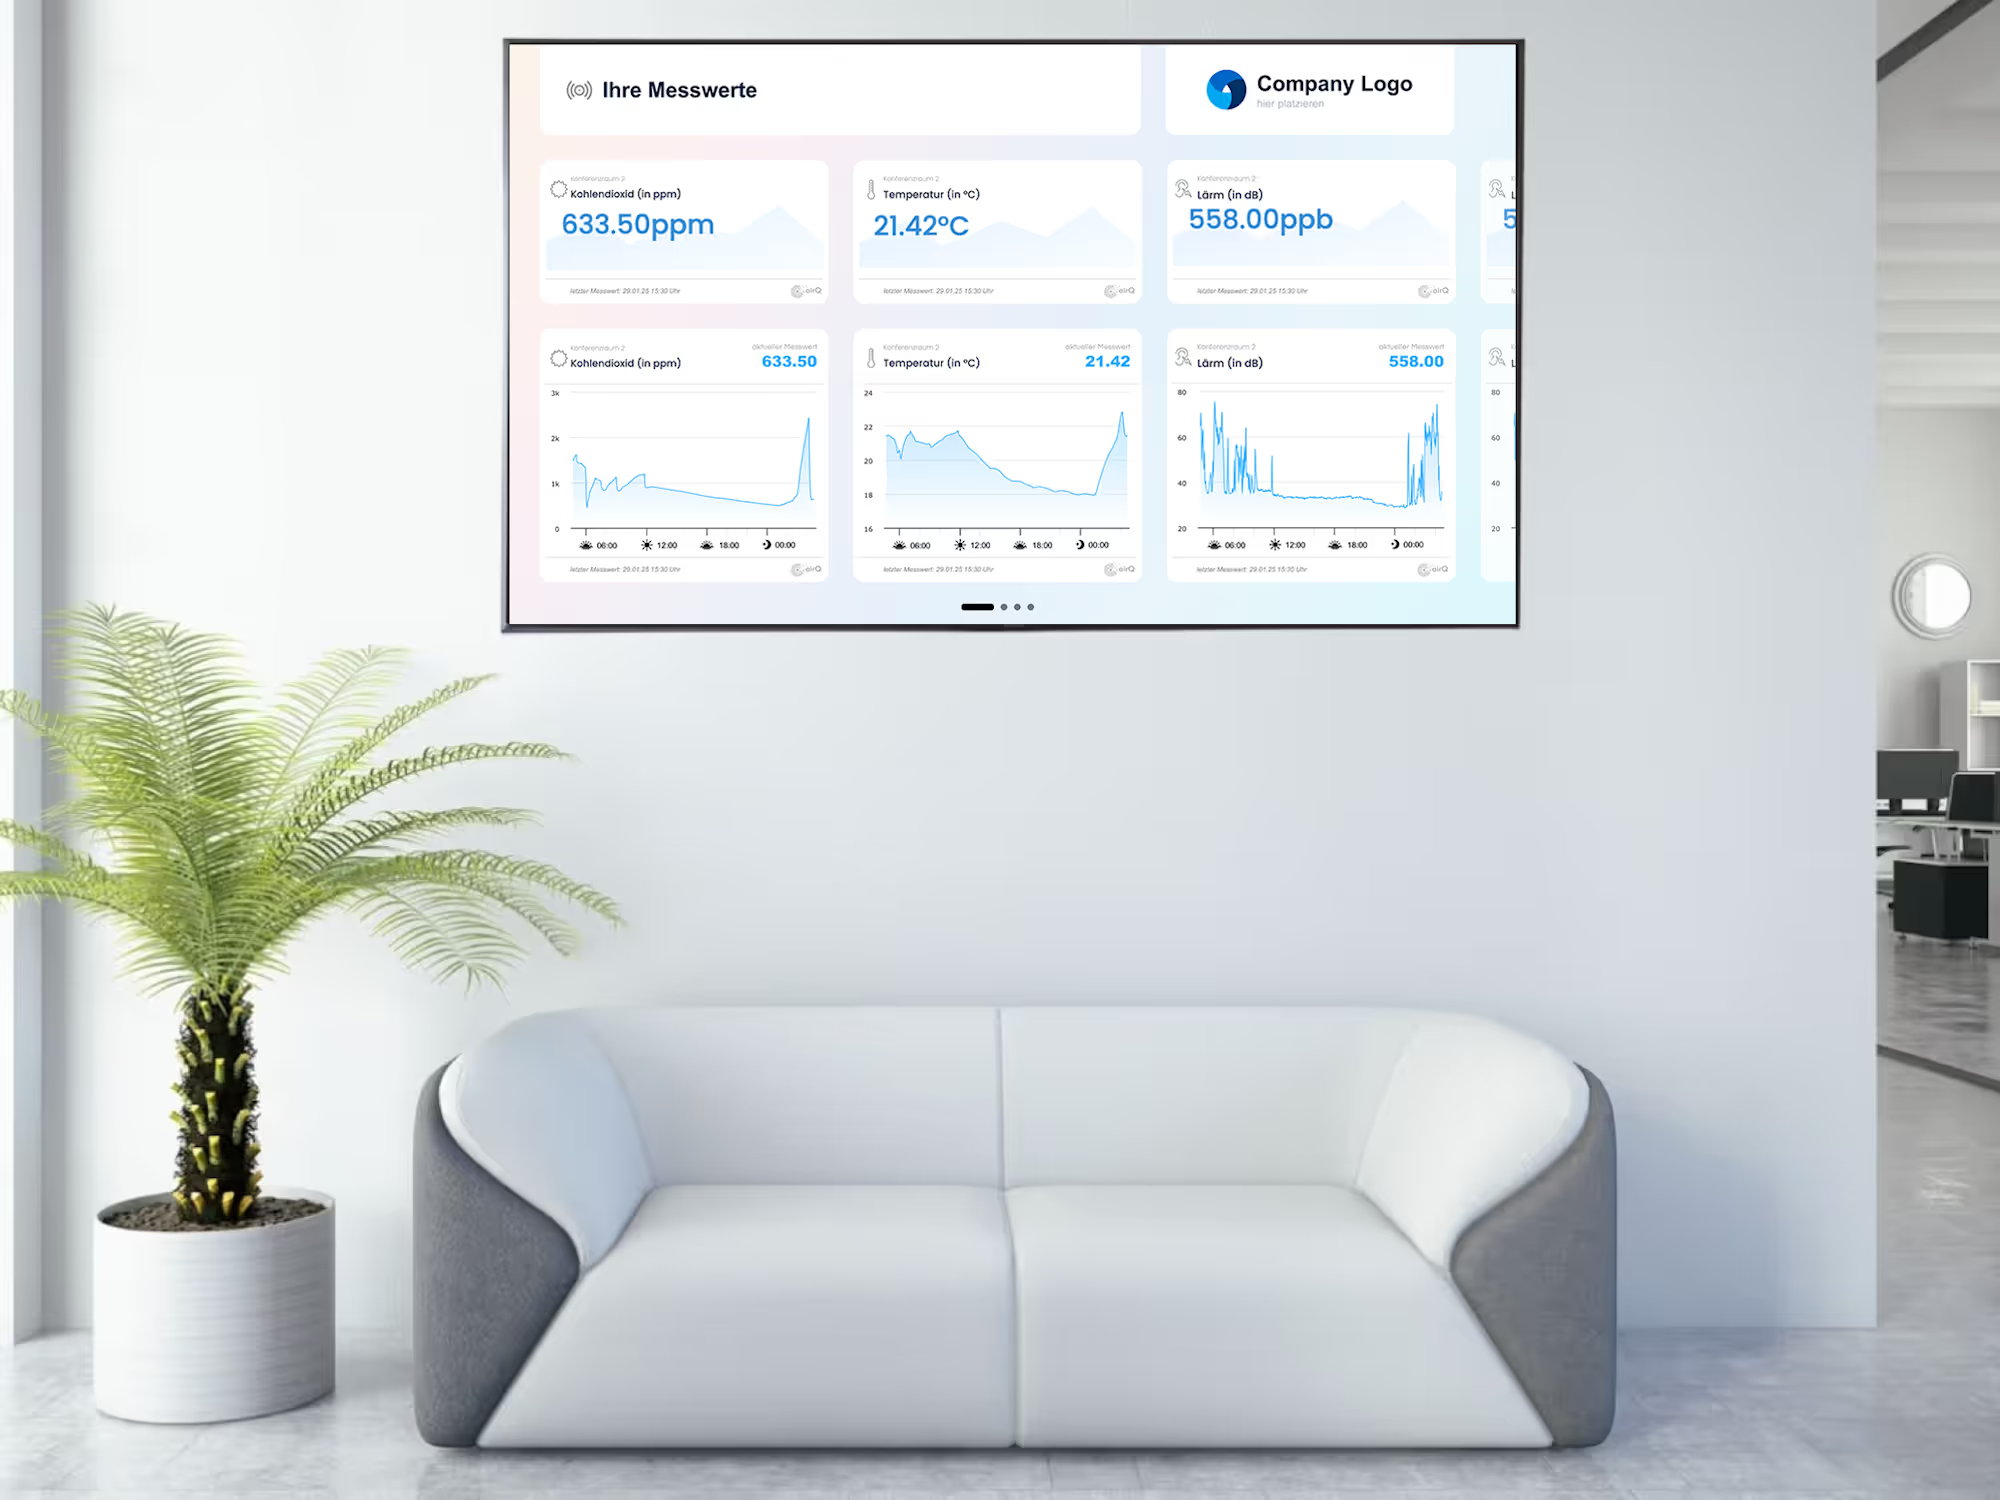
Real-Time Air Quality Data
With our dashboard, you always have access to the current real-time air quality readings. Continuously track key parameters such as temperature, humidity and pollutant levels, and stay in control of the air conditions in your spaces.
This lets you make the right decisions immediately when changes in air quality are detected, and take targeted action to ensure a healthy indoor climate Thanks to real-time data transmission, you always know exactly what the air quality looks like around you, and can react quickly to optimally manage your environment.
Fully Customizable

Design the dashboard exactly to your liking. Adjust how the data is displayed by choosing the parameters that matter most to you. Whether you want to highlight specific readings or filter the display to your needs — everything is flexible and easily configurable.
You can also adapt the dashboard's design to match your corporate design ensuring a consistent and professional presentation of your data. With this complete customizability, you always stay in control and can visualize your information exactly as makes the most sense for your needs.
Simple & Ready to Go Immediately
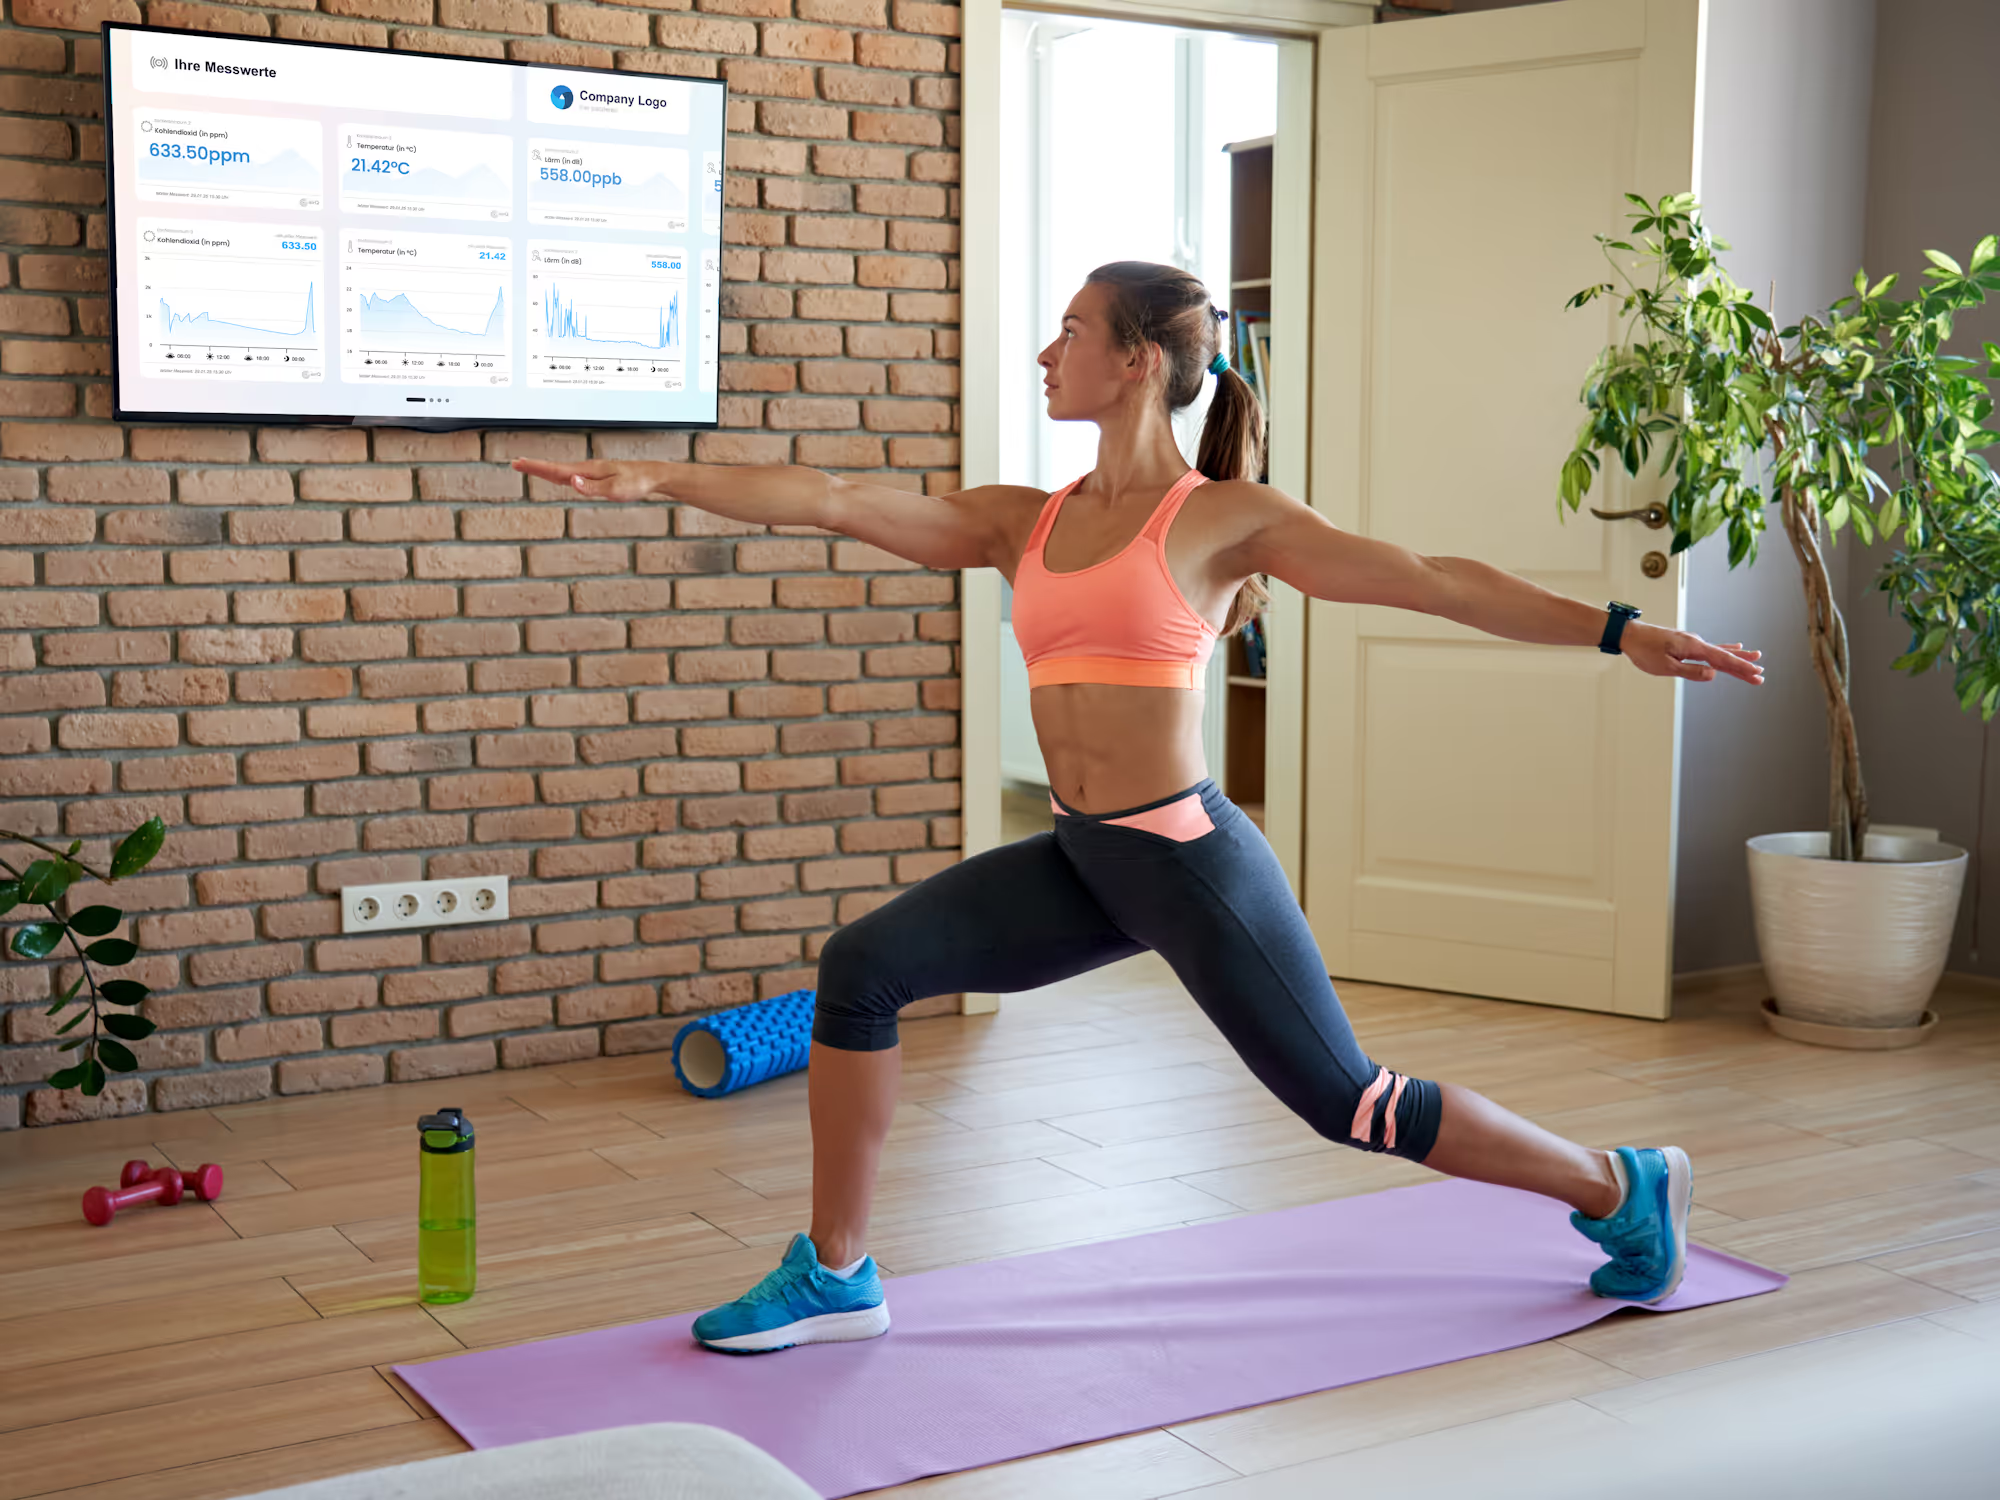
The air-Q View comes complete with everything you need: a screen, a computer, and pre-configured software. So you can put the system into operation right after connecting it. No complicated installation, no long wait times — just plug it in, and you're ready to go.
With this plug-and-play solution, you save valuable time and can focus entirely on using it, without dealing with technical setup. The air-Q View is designed to be ready for immediate use, so you can visualize and monitor your data — efficiently and effortlessly.
Automatic Notifications
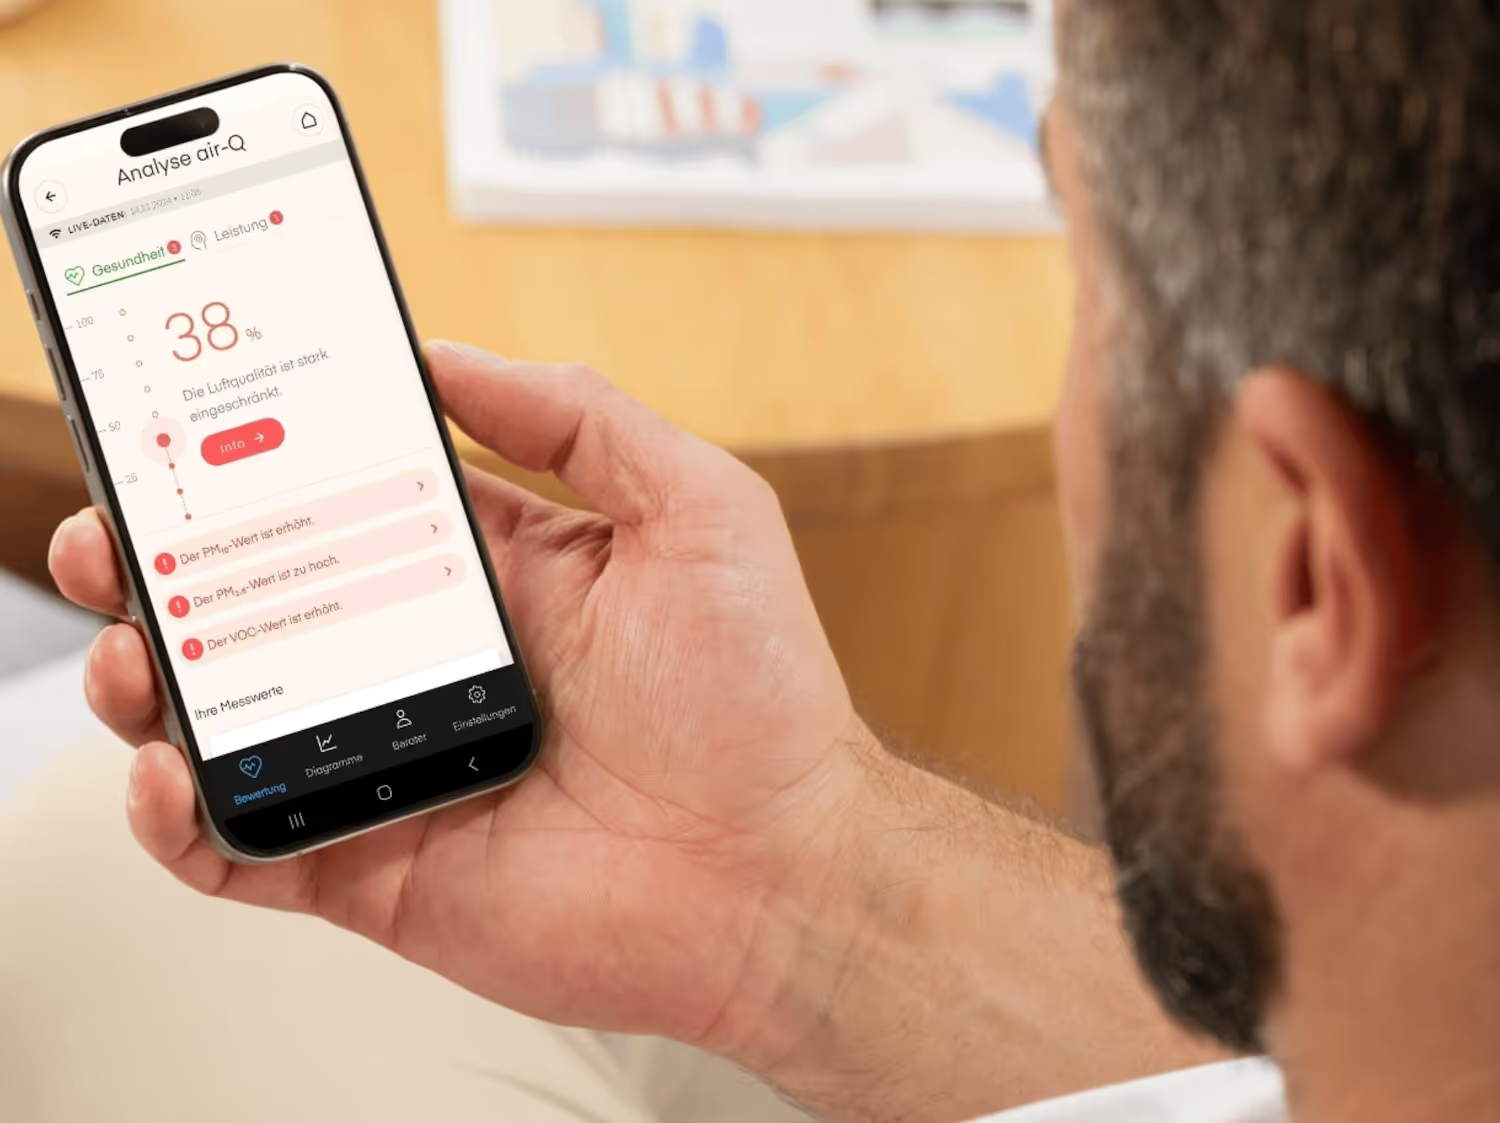
Thanks to our real-time monitoring system, you're notified immediately whenever air quality readings exceed defined thresholds. These instant alerts let you react quickly to changes and take preventive action in time.
This lets you proactively monitor air quality and ensure your environment always meets the desired standards — for a healthy and safe atmosphere.
What Is the air-Q VIEW Dashboard and How Does It Work?
The air-Q VIEW Dashboard is a complete solution for presenting your air quality data. It consists of the following main components:
air-Q Device as the Data Source
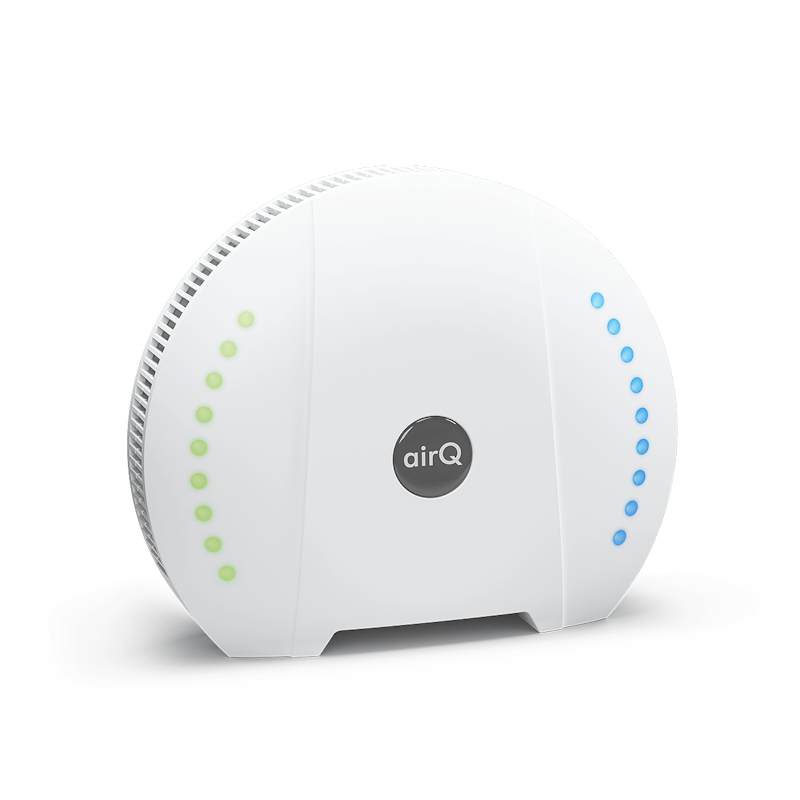
One or more air-Qs provide all the readings displayed on the air-Q VIEW Dashboard. The air-Qs don't need to be placed directly next to the screen — they send measurement data over the internet and can therefore be used anywhere.
Screen for Display
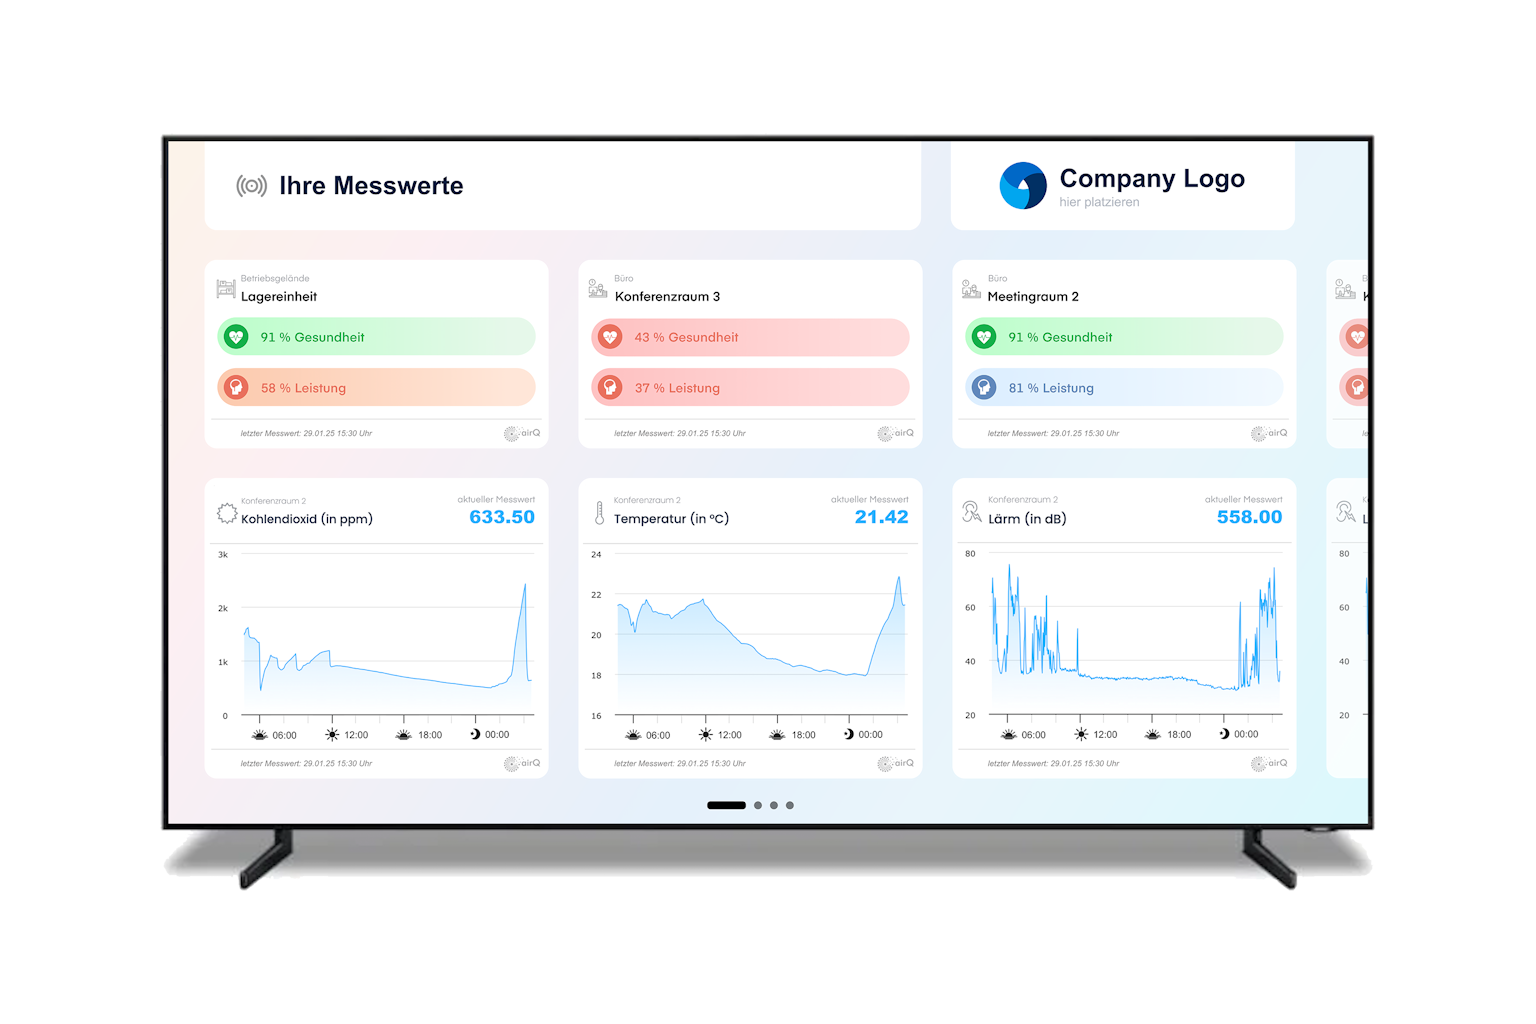
The screen (display): A high-quality, user-friendly display that shows air quality data clearly and in real time. The design can be individually customized to your needs and corporate identity.
Image similar
Mini PC as the Processing Hub
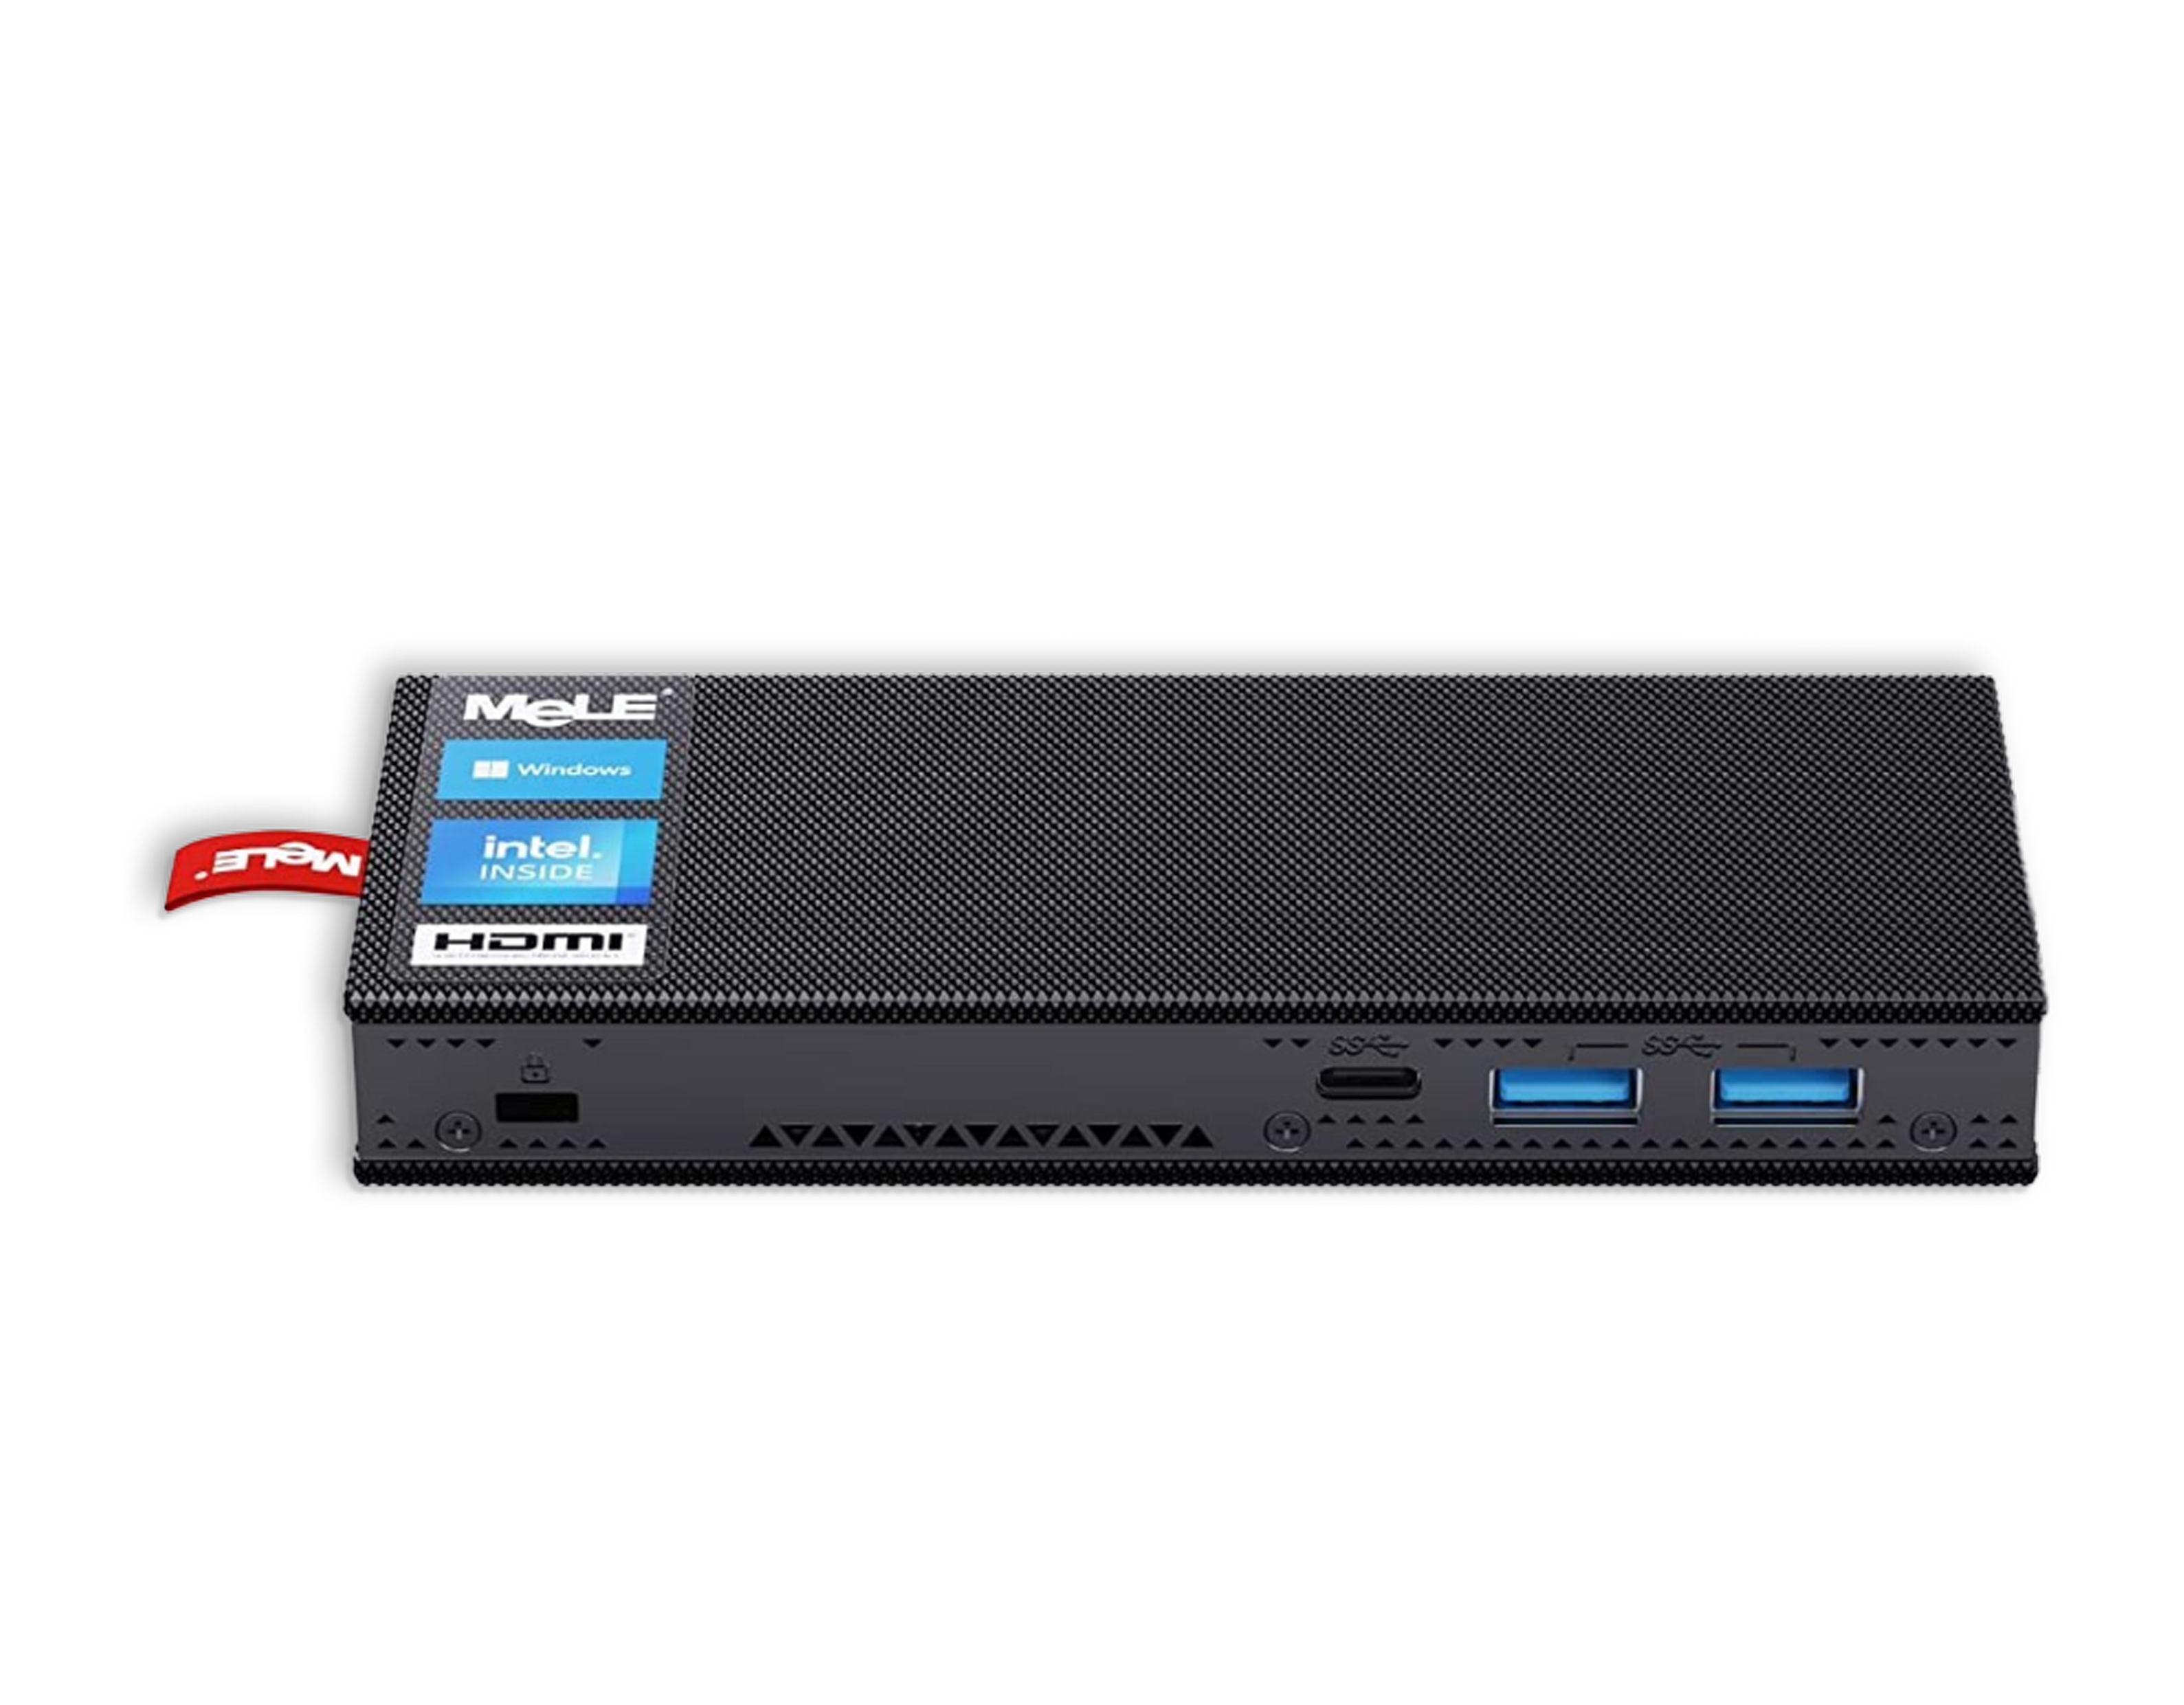
The computer (hub): A compact computer that connects your air-Q device to the screen. The hub processes the data and ensures it's displayed correctly on the screen.
We use a MeLe Mini PC (image similar)
air-Q VIEW Dashboard
Das sagen unsere Kunden
With the air-Q VIEW, we not only always keep an eye on the air quality in our rooms, but can also present the information in an appealing and clear way. For guests especially, the VIEW is a real eye-catcher and always a talking point.