
What's New in Our air-Q App
Our air-Q app can now do even more. We introduce exciting new features that improve your user experience while offering more comfort and more precise monitoring of your room air. Experience the future of air quality measurement with the updated air-Q app – for a healthier and more pleasant indoor climate.

air-Q App: New "Impact on Indices" Feature
With the new "Impact on Indices" feature, you get detailed insights into the factors affecting your air quality. Using the percentages, you can see which readings are responsible, and to what extent, for the deterioration of a particular index. This lets you read off how strongly various pollutants are present in room air and how this exposure affects, for example, the health or performance index.
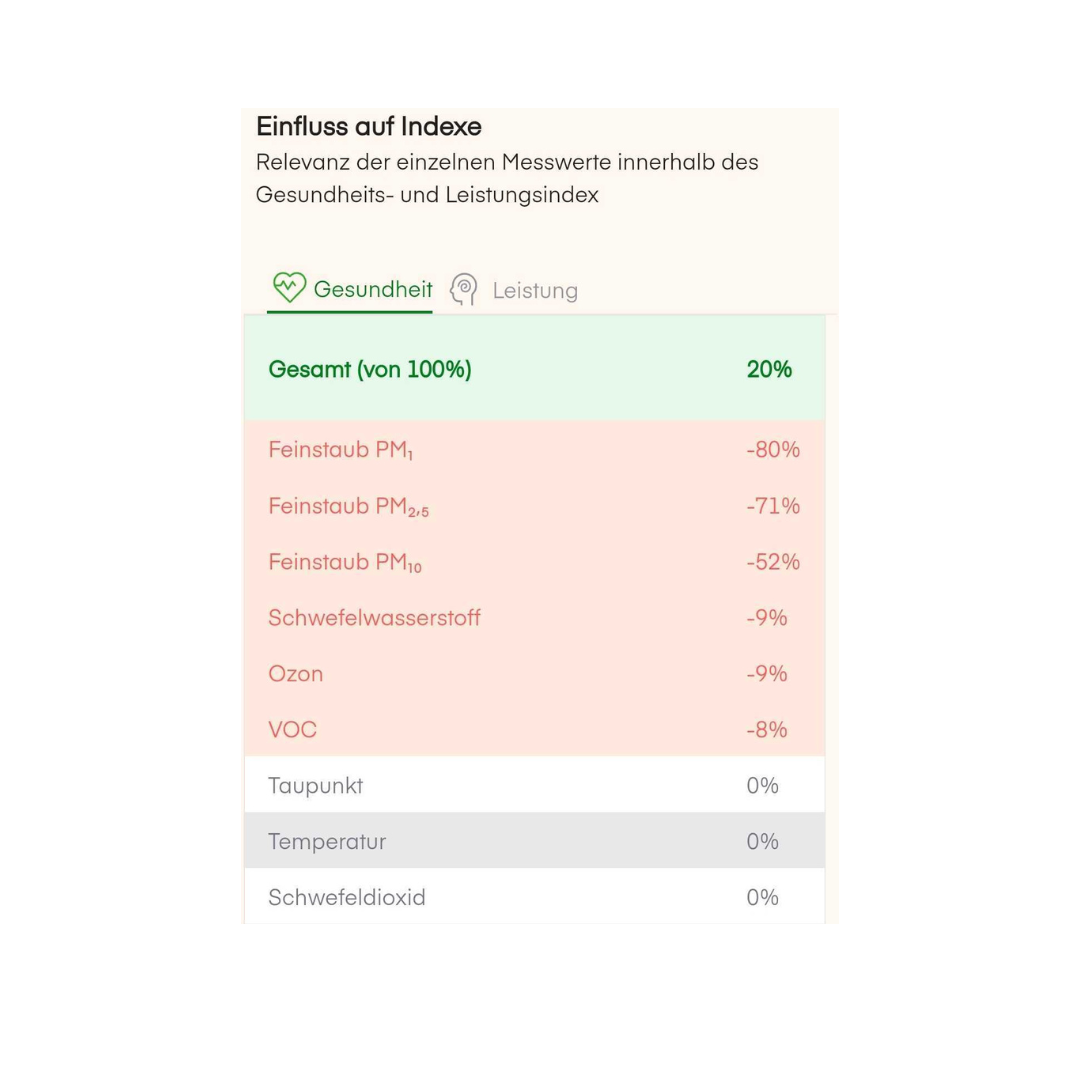
In the example image, you can see that the low health index of only 20 out of the possible 100% is caused by the following air components: particulate matter (PM₁₀, PM₂.₅, PM₁), hydrogen sulfide (H₂S), ozone (O₃), and volatile organic compounds (VOC). The sum of these pollutants leads to a reduction in air quality. By seeing them listed individually, you can take targeted countermeasures and carry out appropriate action, such as an air exchange.
New design for chart displays
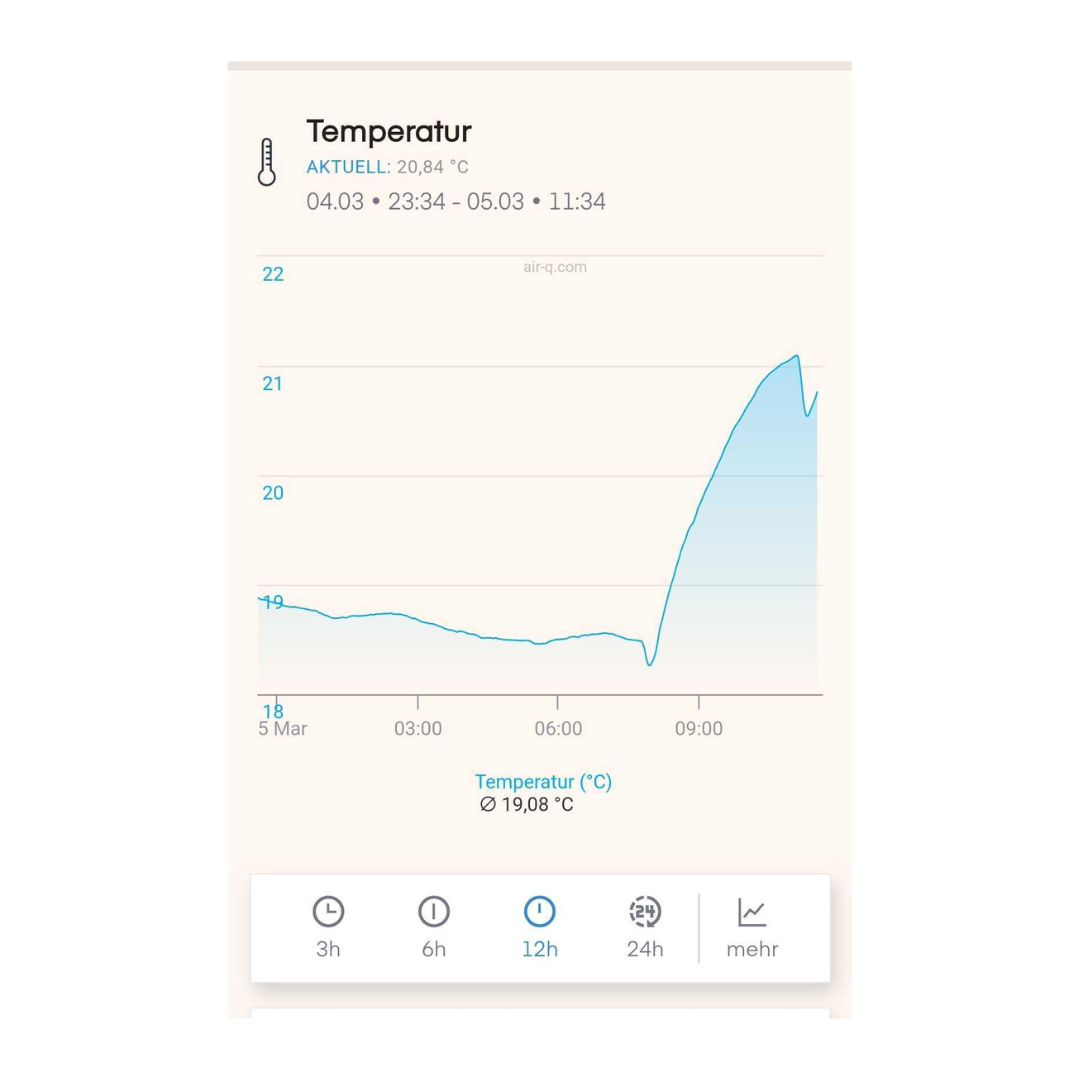
Our revamped chart legends ensure an appealing and user-friendly display of your air quality data. To do this, we've integrated clear lines for better readability.
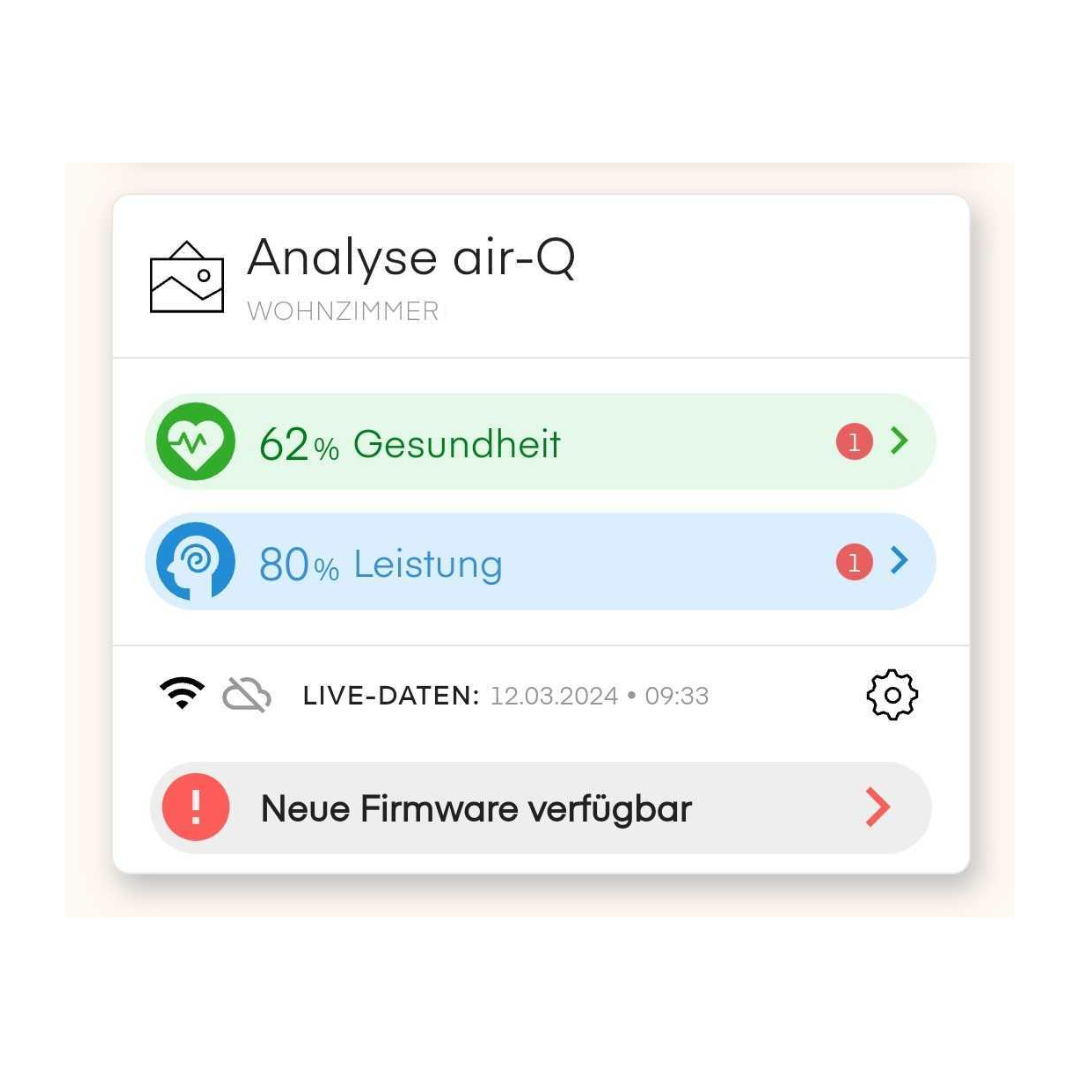
New in the air-Q App: Optimized Display of Errors & Updates
We haven't just improved the features, we've also improved how we present information about errors and updates to you. With our optimized display, you get clear and understandable notifications, so you're always informed about any issues or updates. This way, you always stay up to date, never miss important notices again, and can rely on a smooth, user-friendly experience.
Other important changes in the revamped air-Q app at a glance:
Sensor sorting
For easier navigation, you can now sort the available sensors alphabetically by name. For better organization and configuration of the sensors, you can also use various sub-sections. These include calibration, available special sensors, and indices. In the sensor calibration sub-section, you can choose between automatic and manual calibration.
In the special sensors sub-section, you set factors for the PID sensor and activate several virtual sensors in your air quality monitor. From the measurement data of the built-in sensors, the readings for the virtual sensors absolute humidity (φ), noise (Lp), dew point (Td) are calculated, and temperature can be displayed in both Celsius and Fahrenheit. In the indices sub-section, you can display the virus-free index and exclude the VOC pollutant from the index calculation. This is practical, for example, if you use a lot of perfume, use strong cleaning products, or are planning a dinner party with wine. All these activities release fragrances that the VOC sensor reacts to. To avoid permanently high values and thus alarms or a poor index, disable VOC for the index calculation.
Saving settings without a restart
Some settings are now saved without requiring a restart. You can now set your preferred settings without having to restart the app, enjoying a smoother workflow.
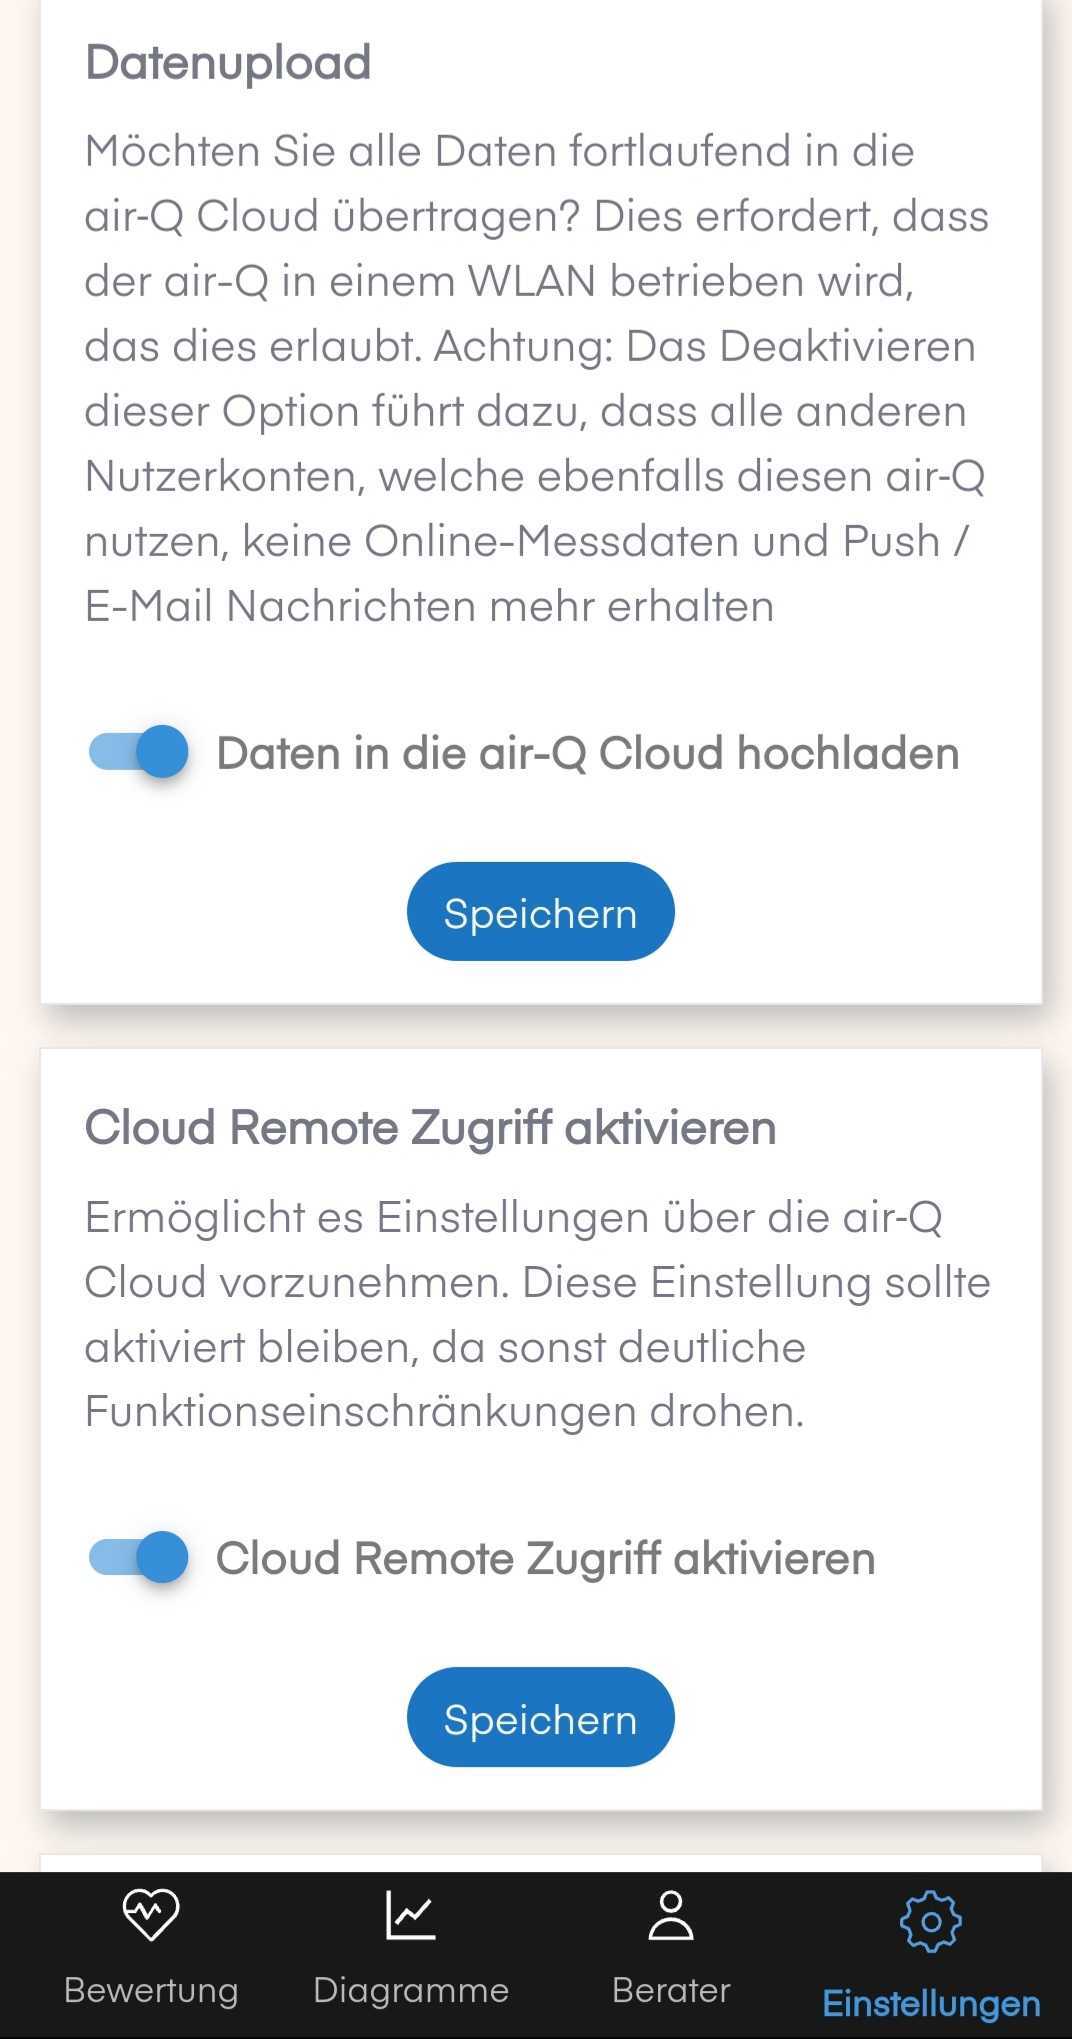
Cloud access switch
We've also added a cloud access switch that gives you full control over access to your data. Through (temporary) remote access, you enable better remote diagnostics. This lets air-Q support, for example, detect defective sensors and offer you a solution faster than if you had to mail in the air quality monitor.
Repeating alarm for exceeded readings
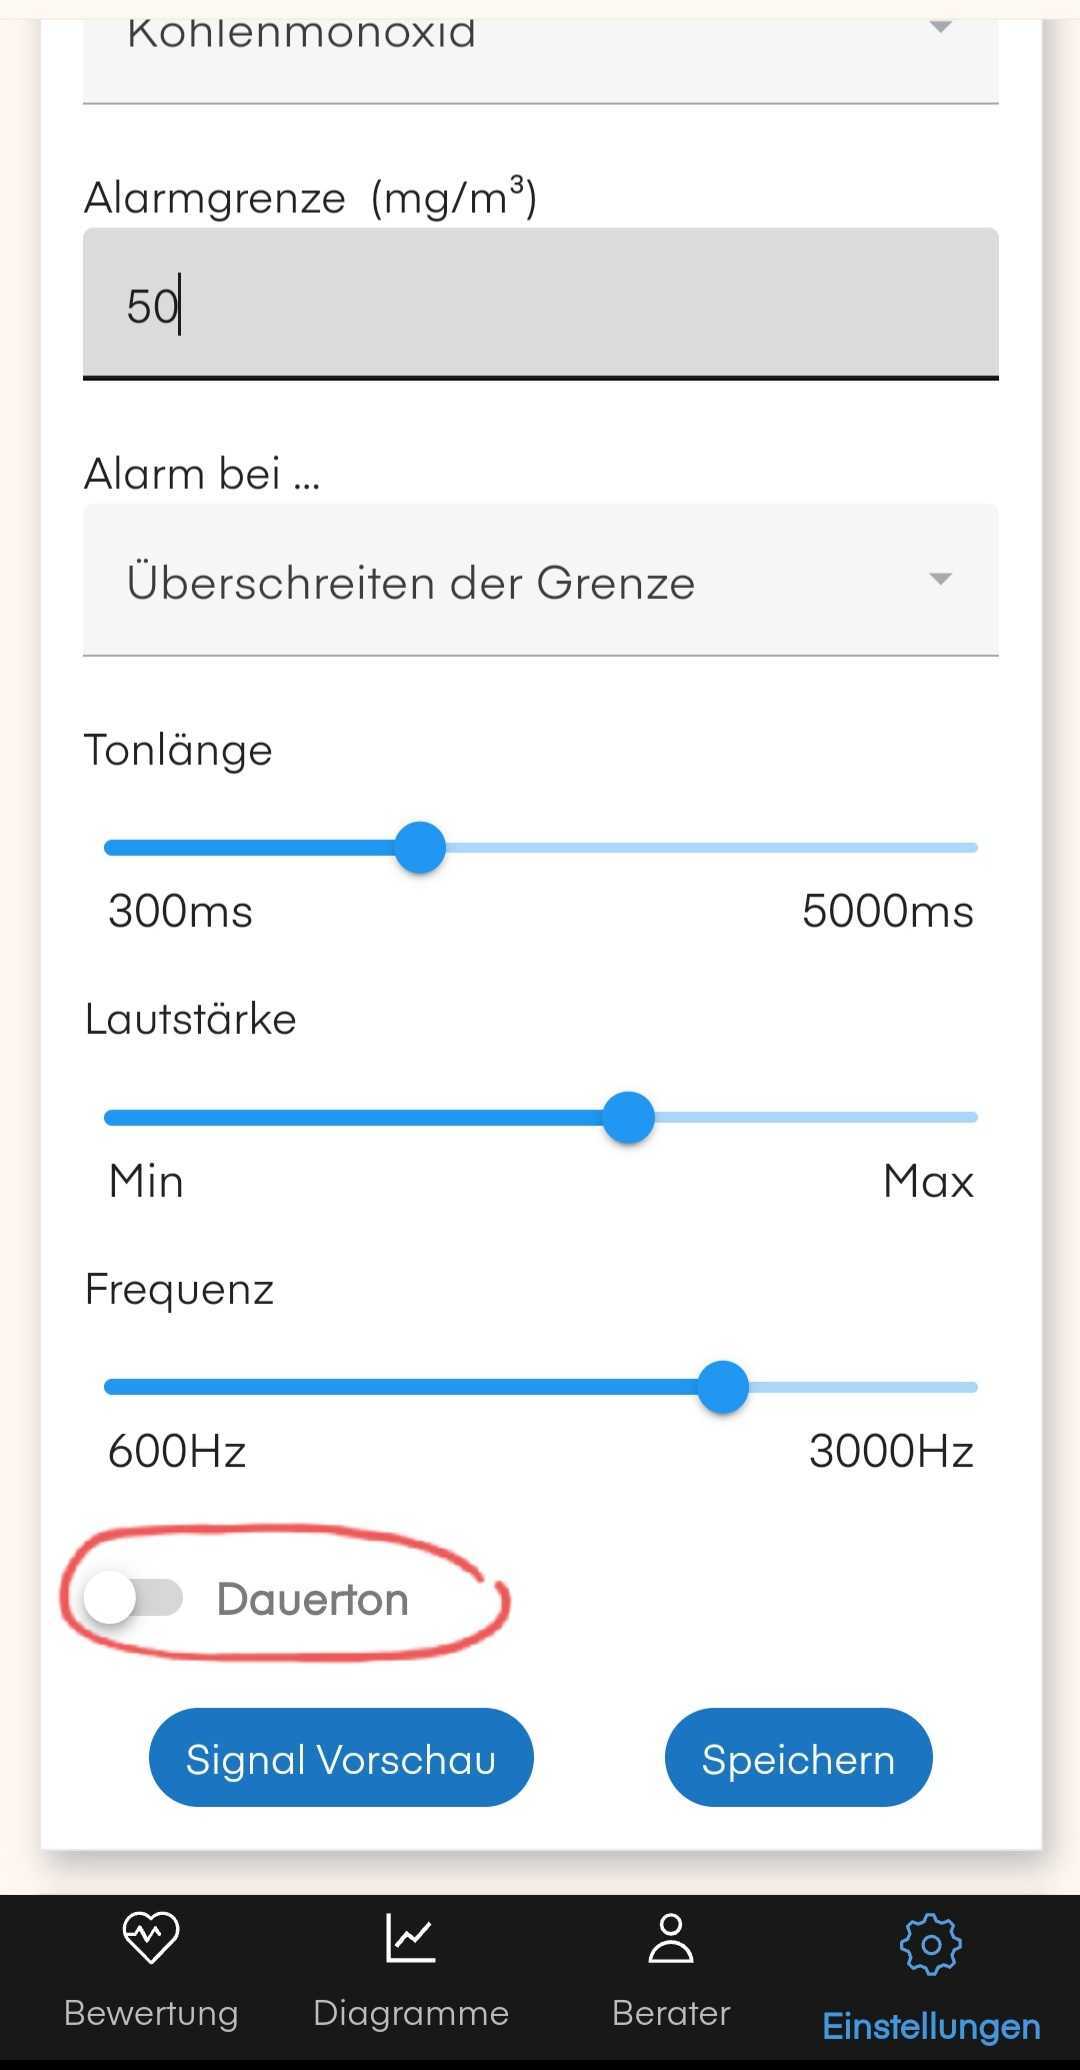
Previously, only a single tone sounded when set limit values were exceeded. With the update, you can enable the continuous-tone toggle. This causes the tone to repeat every 30 seconds as long as the value is exceeded. This is especially helpful for toxic or life-threatening readings like carbon monoxide. While a single alarm can be missed, a repeating signal draws attention and can even wake you up in a dangerous situation.
Conclusion
Although you can't see it directly in the app, our developers brought the app up to date in version 2.0. Using the latest plugins and libraries, they've made the app fit to already meet the demands of the future.
Overall, you can expect the following improvements with the air-Q app update:
- structural improvements
- support for the latest iOS & Android versions
- better scalability
- increased robustness
- focus on user-friendliness
Check out the changes directly in your app and try out our updates.