
The Corona Effect: Lockdown Significantly Reduces NO₂ Pollution
How is air quality developing during the Corona pandemic? Data is often picked out and interpreted in isolation these days. But such analyses don't do justice to the complex relationships surrounding pollutants. Now researchers have presented a more in-depth analysis showing that the lockdown significantly reduces NO₂ pollution.

Scientists at the Earth Observation Center (EOC) of the German Aerospace Center (DLR) have used their analyses to provide scientifically sound evidence of the Corona effect on air quality. The lockdown in Lombardy — a region hit hard by the Corona pandemic — led to a genuine reduction in nitrogen dioxide pollution of around 20 µg/m³ in March. That corresponds to a decline of 45 percent.
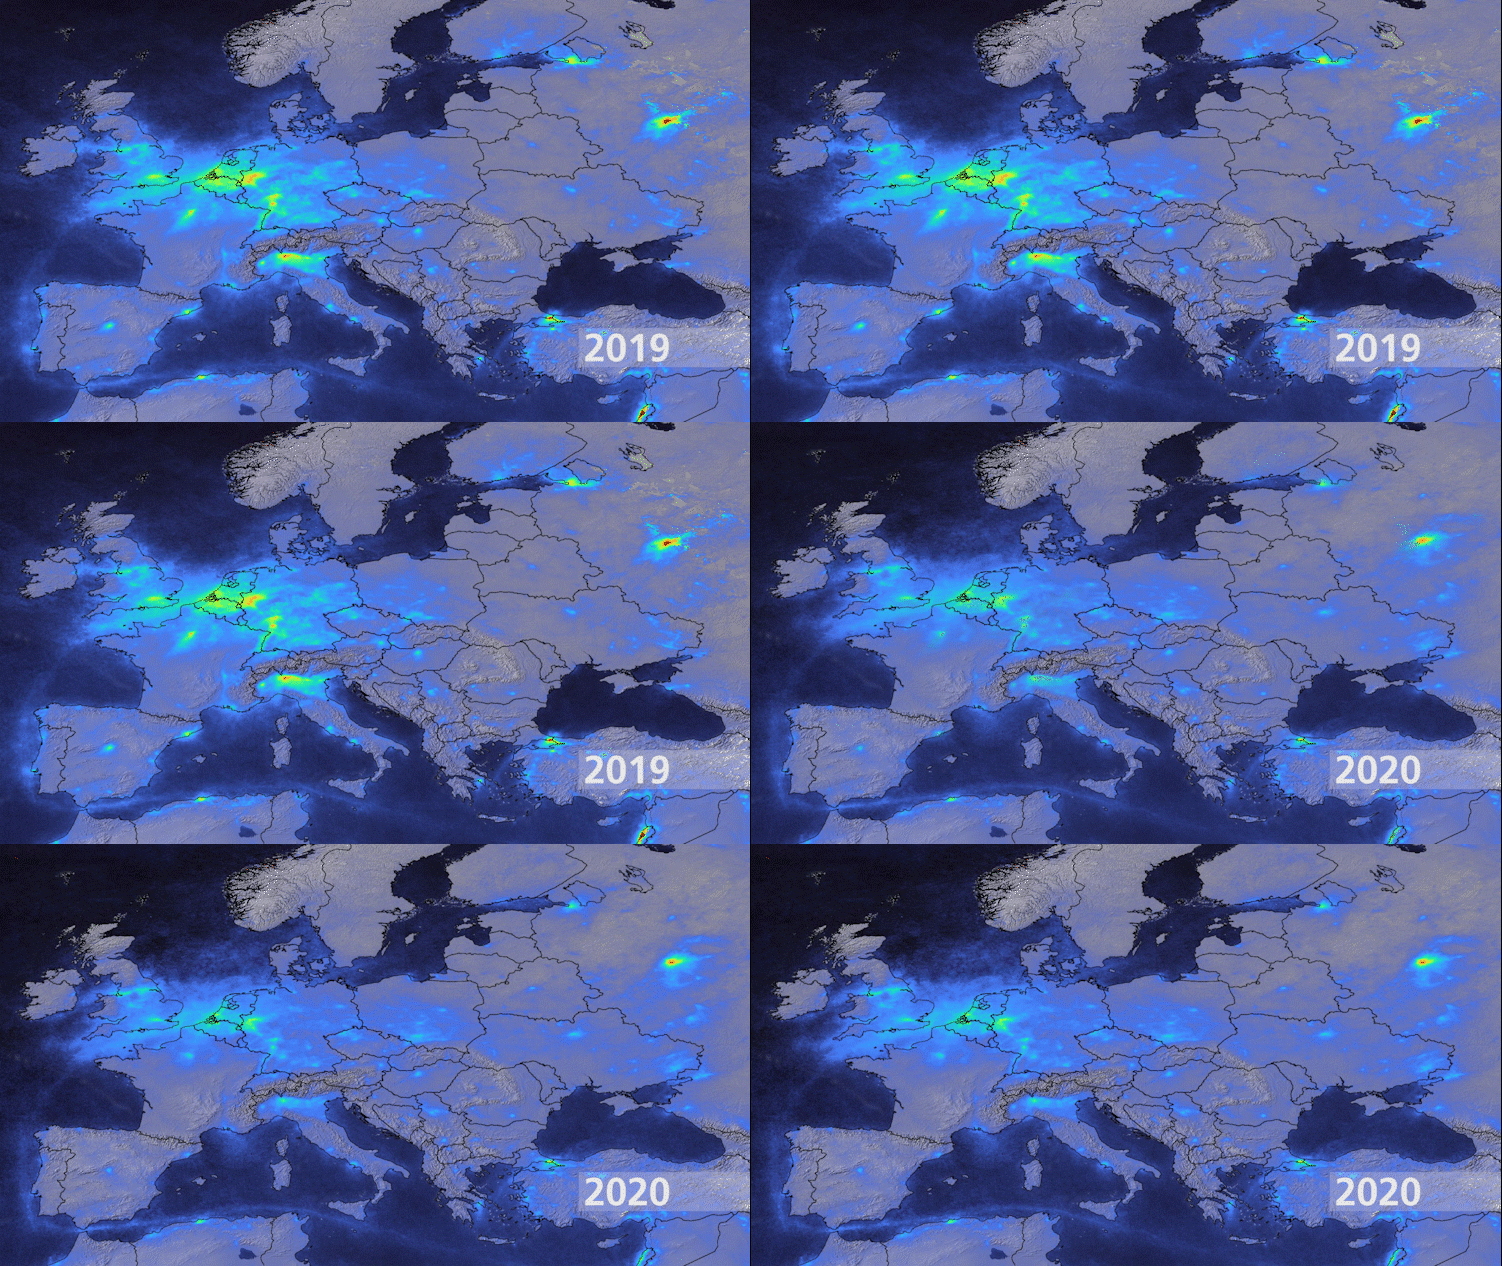
On March 8, 2020, the Italian government enforced quarantine measures in rapid succession. Since then, satellite and ground measurements have shown deviations from the long-term average — but the researchers interpret this only as an initial indication. Instead, they dug deeper into the analysis and factored in the influence of the weather, simulating pollutant levels on a computer.
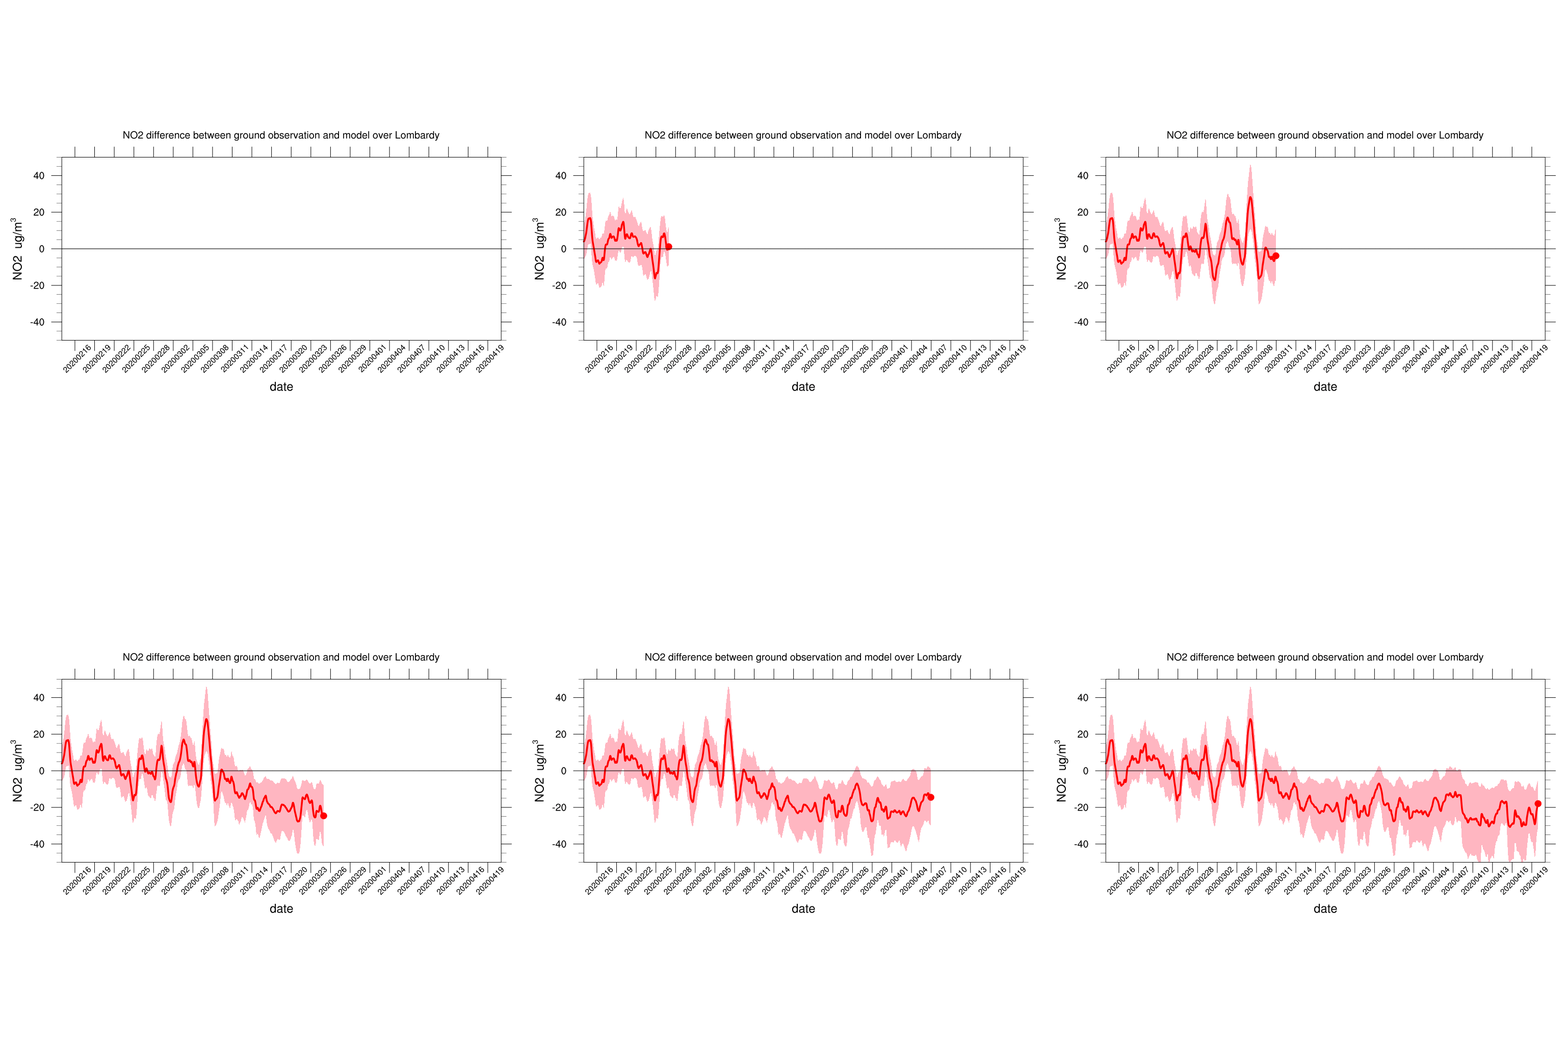
The evaluation of pollutant emission values was used to establish an average over several years. This average now represents the normal situation, factoring in the actual weather conditions hour by hour. The researchers then compared this data with the measurement data from 2020. To do this, the modeled normal situation was subtracted from the actual ground measurements. The result is clear: when the lockdown measures began in Lombardy on March 8, there was a genuine reduction in nitrogen dioxide pollution of around 20 µg/m³, as described above.
Researchers combined different data sources to prove the Corona effect
To validate these findings on the Corona effect, the scientists combined satellite measurements, in-situ data, and the results of computer models. That's because atmospheric processes are far too complex for blanket assessments. Only through further analysis can it be determined whether the measured values are due to specific local weather conditions or a later start of lockdown measures, according to the scientists. For the detailed analysis of the situation in Lombardy, data from the European MetOp-A satellite was used.
Since 2018, the Sentinel-5P satellite has also provided measurements with higher resolution — though these are currently only sufficient for comparisons between 2019 and 2020. To reduce the weather effect in this analysis as well, global monthly averages were calculated, incorporating 1.2 trillion individual DLR measurements. This data, too — although not weather-independent — shows a clear reduction in emissions. In the future, this higher-resolution data is expected to help trace emission sources and pollutant transport even more precisely.